50% Off Black Friday Sale
This Sale ends in
00d
00h
00m
00s
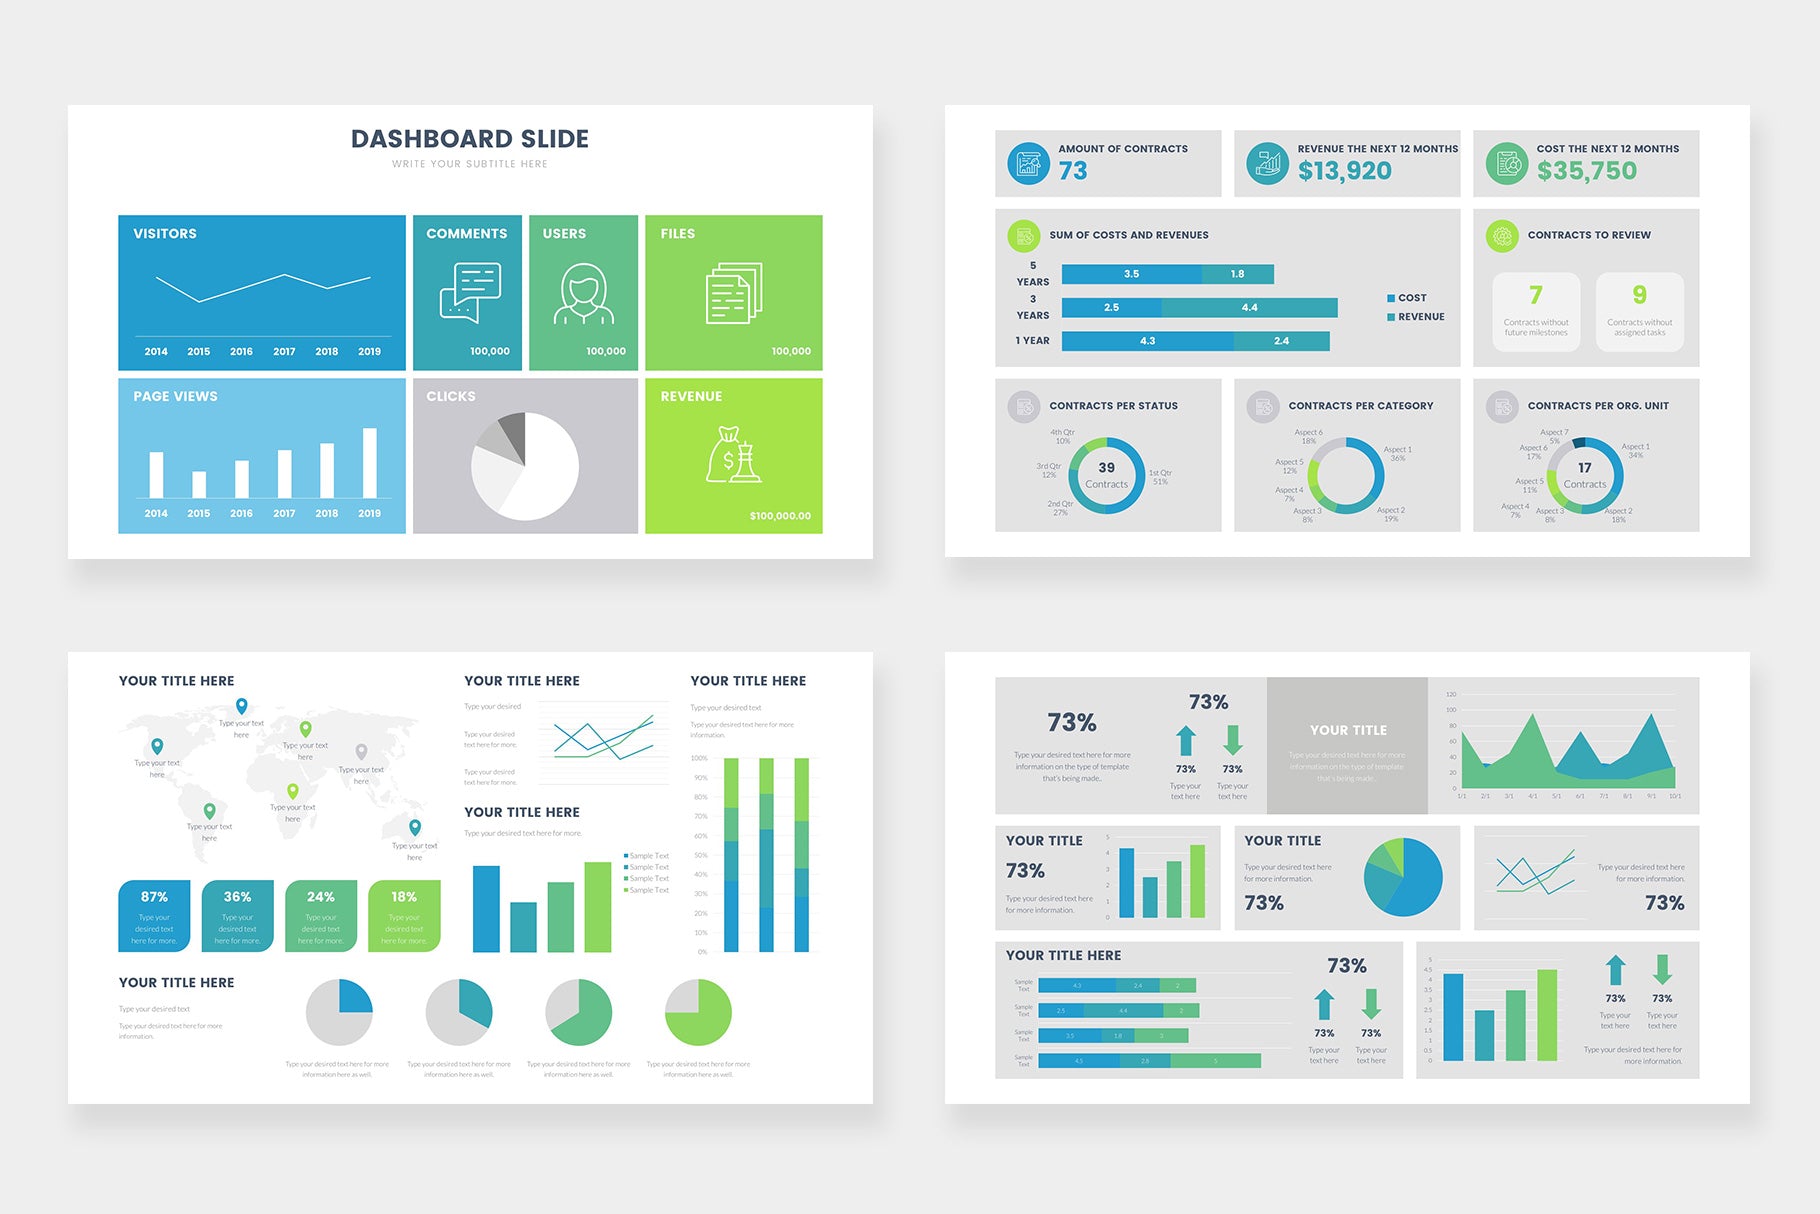
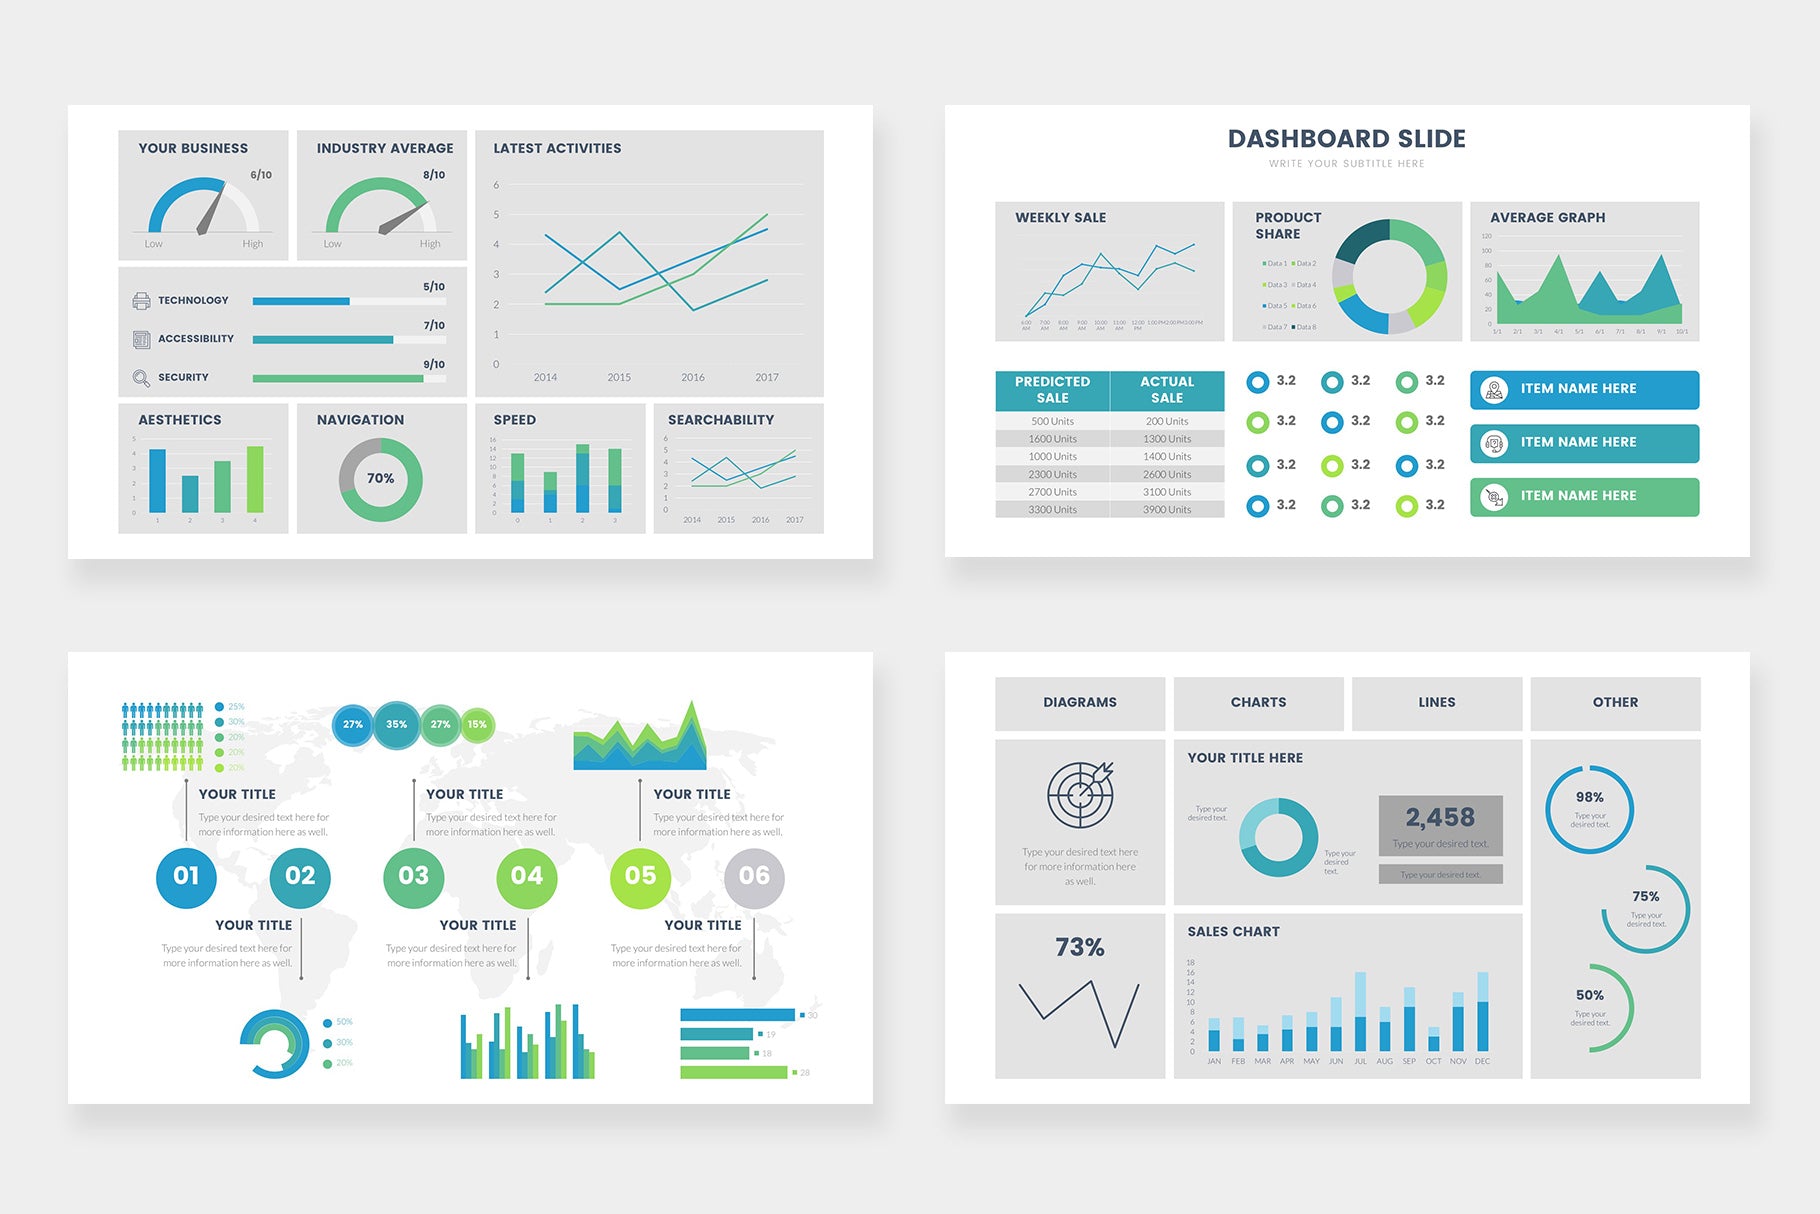
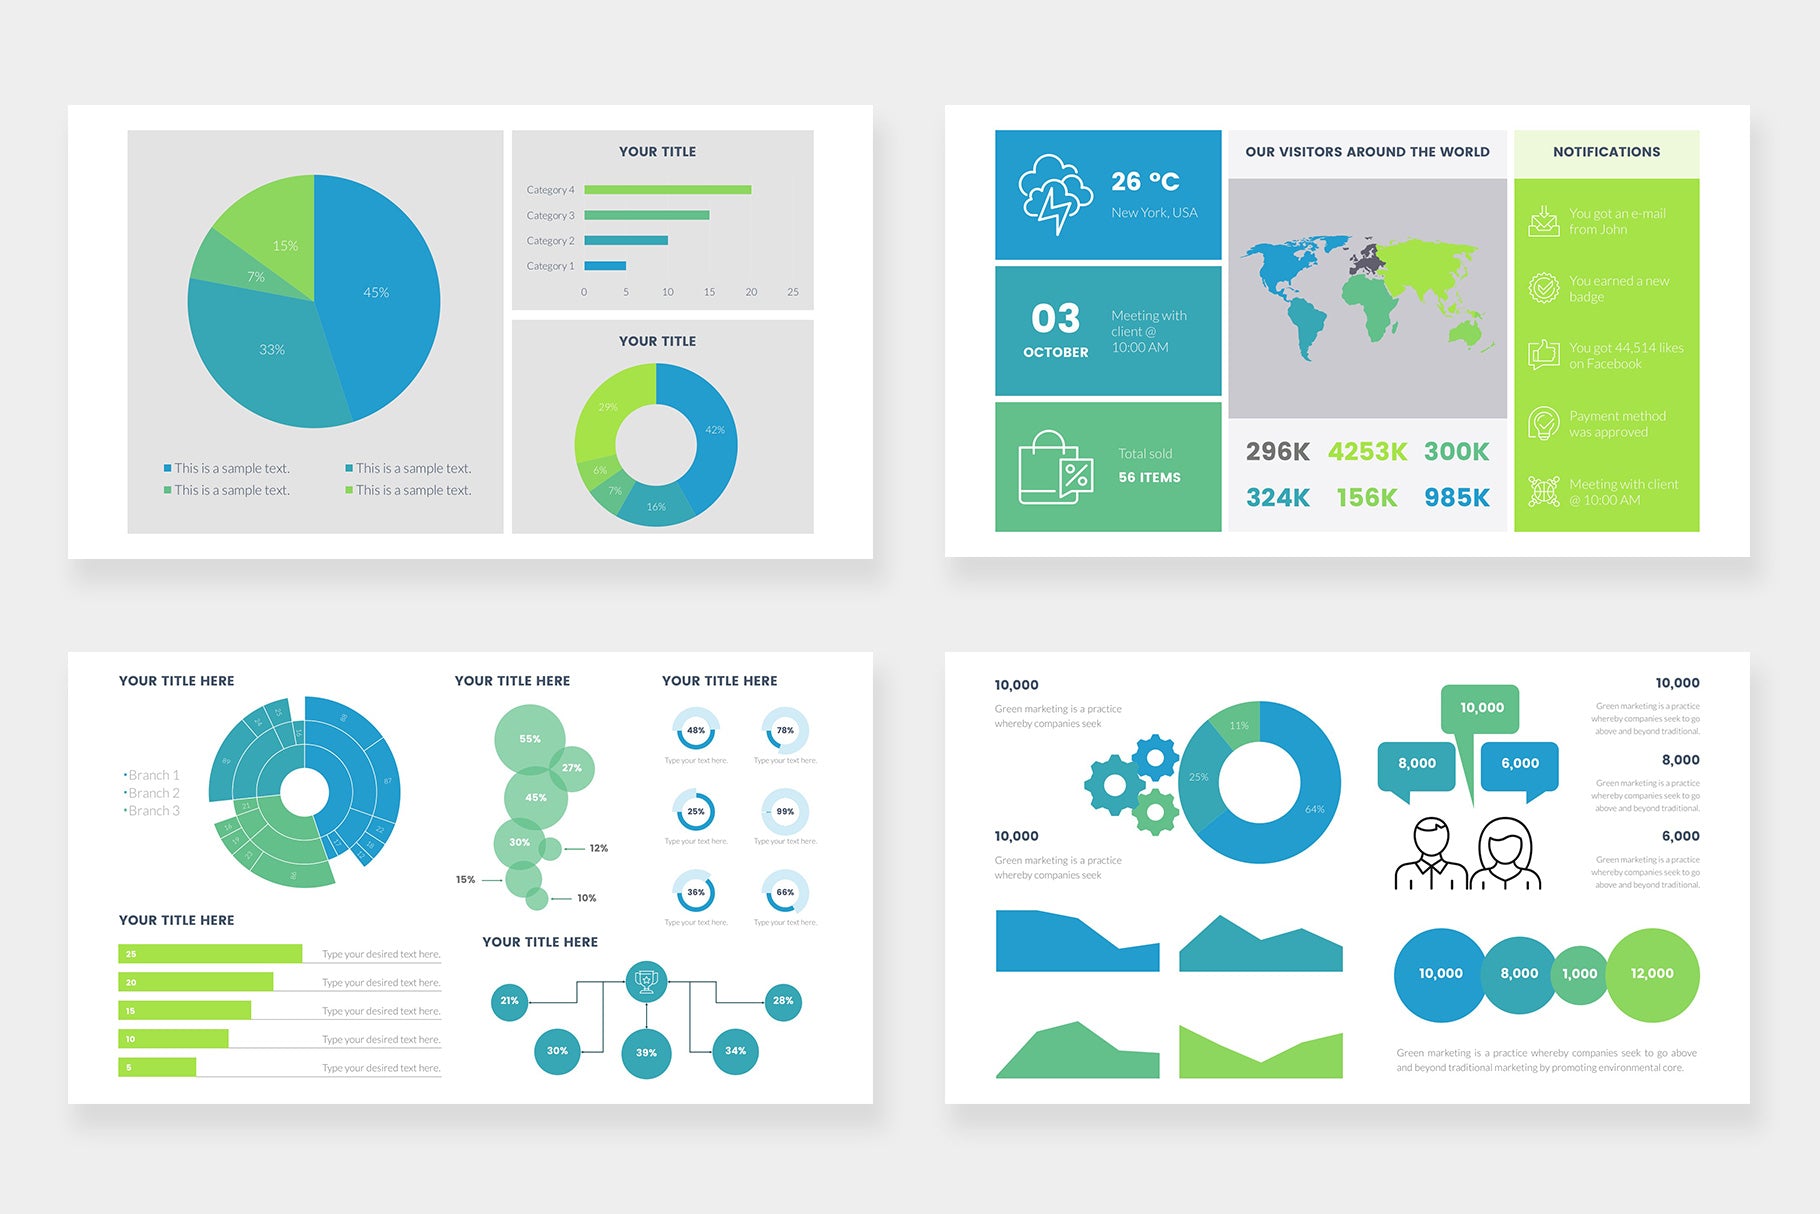
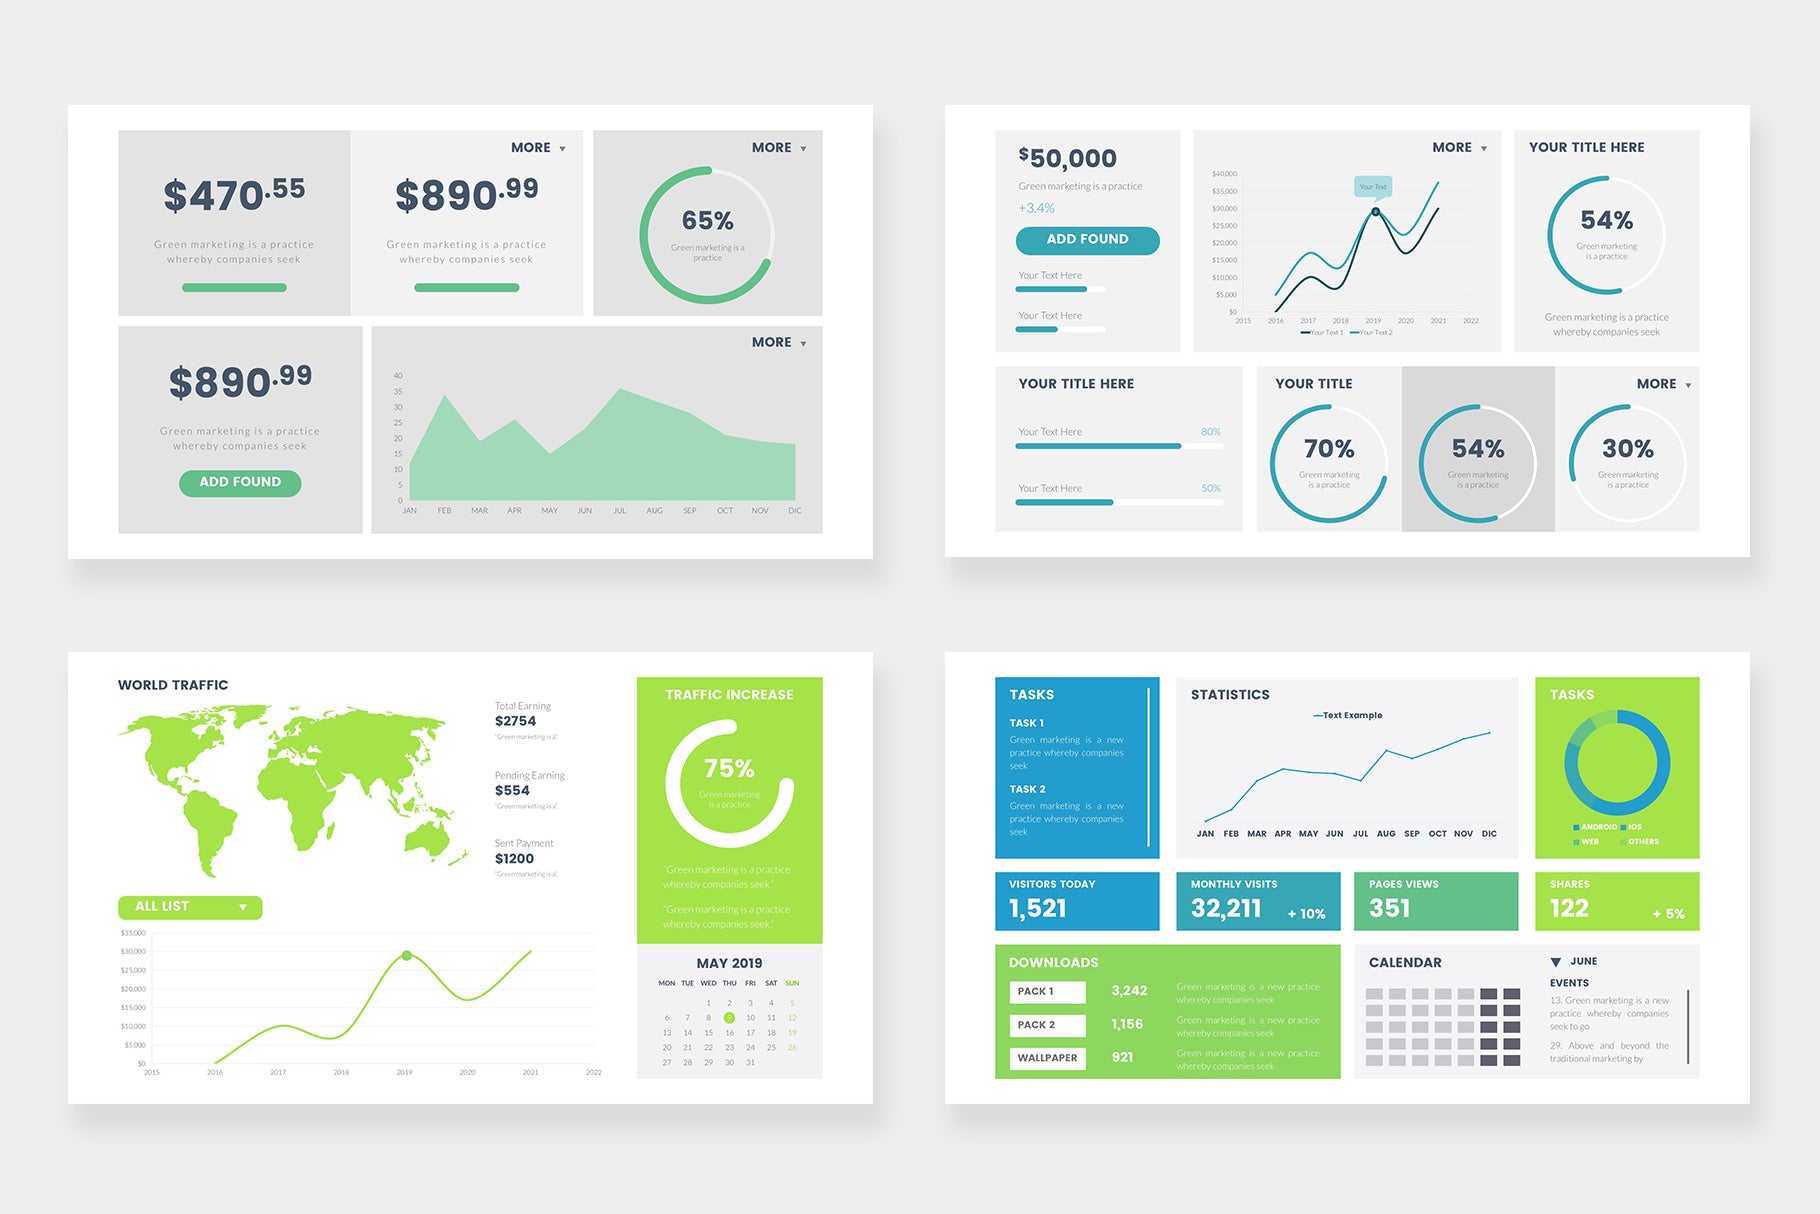
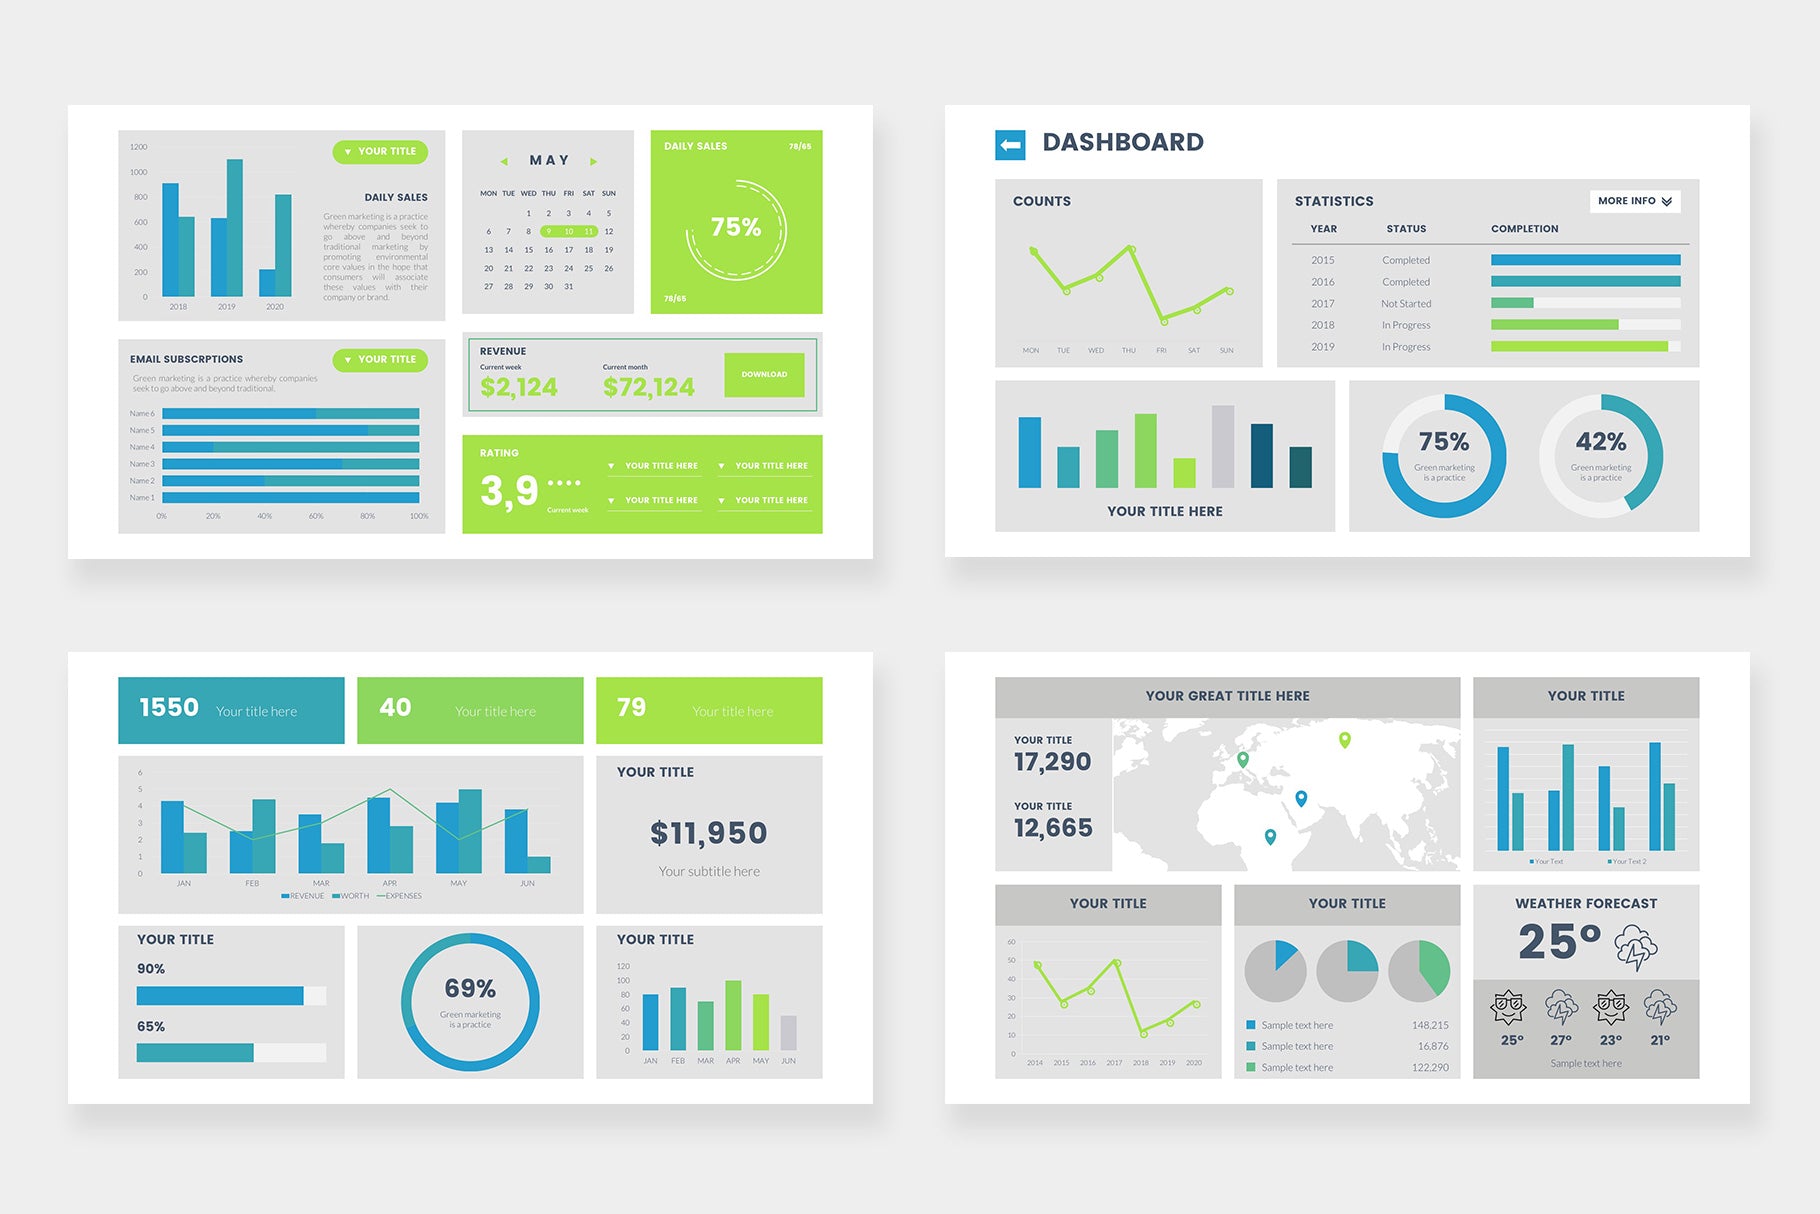
Any business knows that there's multiple expenses and income flows that come each day. Our Dashboard infographics are perfect for those who are looking to represent all their numbers in a single place with charts. These Dashboards can be used to show income, expenses, statistic, employee productivity and so much more.
Use these dashboard diagrams for any project, presentation or monthly report. Our dashboards are also perfect for representing different global statistics to keep your company on track.
Customer Reviews
Based on 10 reviews
Write a review

