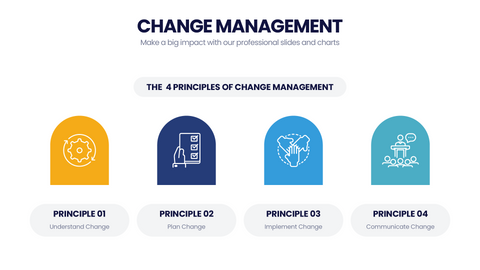
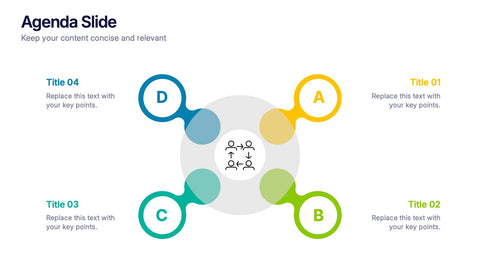
A fishbone diagram makes the path from symptom to root cause something a team can actually discuss. This pack of twenty fishbone infographic layouts gives quality engineers, ops leaders, and consultants polished Ishikawa-style visuals for root cause analysis sessions, retrospectives, and problem-solving workshops.
Use the classic six-bone fishbone for manufacturing 6M analysis, the simplified four-bone version for lean retrospectives, the categorized fishbone for service-sector root cause work, and the expanded fishbone when each bone needs its own substeps. Each design keeps the spine straight and the bones balanced so the diagram reads as fast as a whiteboard sketch.
Open the file in PowerPoint, Keynote, or Google Slides and update causes, categories, and colors in minutes. A solid fit for quality improvement decks, incident reviews, ops retrospectives, classroom case studies, and any moment when the team needs to see the structure behind the problem.