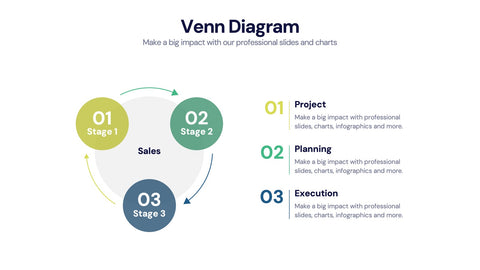
The circle is one of the most adaptable shapes in a presenter's toolkit, perfect for cycles that repeat, frameworks that radiate from a center, and concepts that connect without a clear start or end. This pack of twenty circle infographic layouts gives designers, consultants, and educators a polished visual library for cyclical processes, hub-and-spoke models, and segmented analysis.
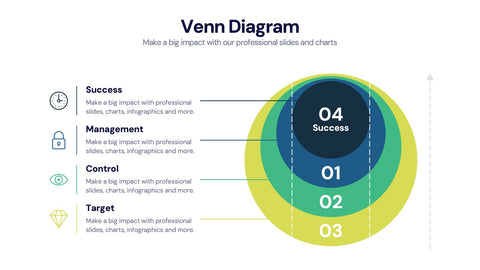
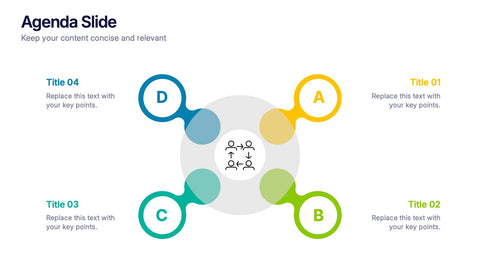
Use the simple ring chart for share-of-total, the segmented donut for category breakdowns, the hub-and-spoke for capability maps, and the concentric circle for hierarchical relationships. Each design balances geometric precision with the visual breathing room a slide needs to read well at a glance.
Open the file in PowerPoint, Keynote, or Google Slides and update labels, percentages, and colors in minutes. A solid fit for cycle diagrams, framework introductions, market share breakdowns, audience targeting, and any topic where the message is best told in the shape of a circle.