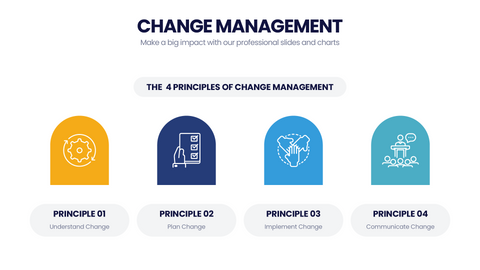
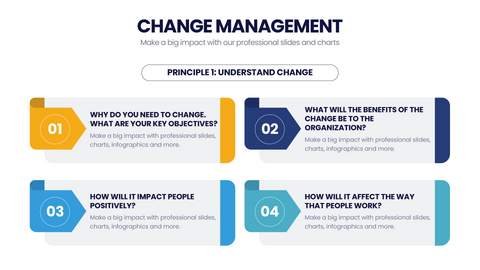
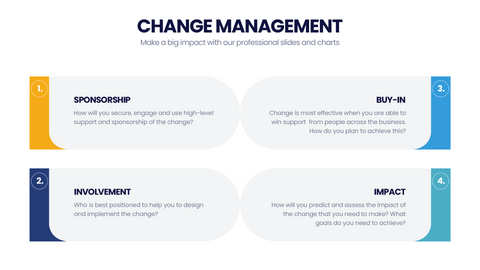
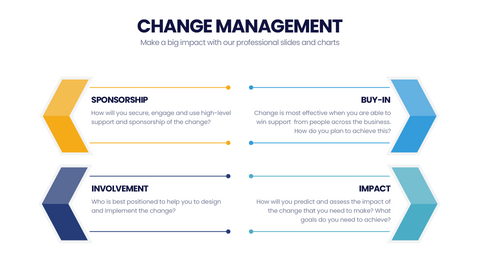
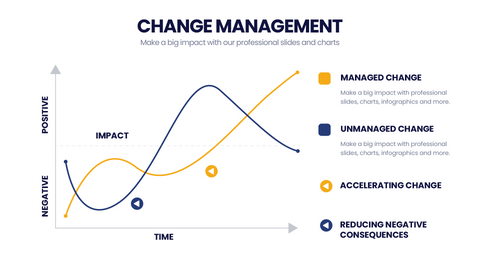
Environmental content carries weight because the audience already cares — and the visuals have to be as serious as the subject. This pack of twenty environmental infographic layouts gives sustainability officers, ESG analysts, environmental educators, and nonprofit communicators polished visuals for climate storytelling, conservation reporting, emissions breakdowns, and the kind of evidence-based communication that turns concern into action.
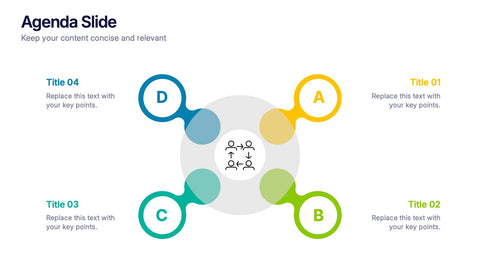
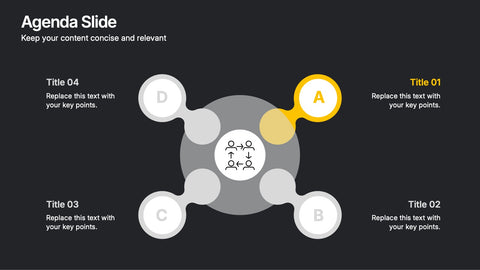
Use the carbon footprint layout for emissions storytelling, the conservation cycle diagram for ecology education, the pollution comparison layout for impact reporting, and the sustainability pillars layout for ESG and corporate-responsibility decks. Each design balances scientific accuracy with the visual warmth that environmental conversations deserve.
Open the file in PowerPoint, Keynote, or Google Slides and update statistics, milestones, and brand colors in minutes. A solid fit for sustainability reports, climate-action campaigns, environmental education curricula, corporate ESG briefings, and any moment when the audience needs the environmental story told well.