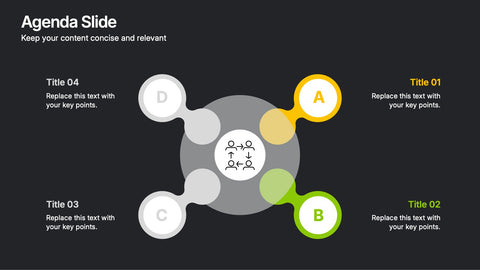
Statistics decks turn raw numbers, survey data, and research findings into confident at-a-glance storytelling. This pack of twenty statistics infographic layouts gives researchers, marketers, journalists, educators, and BI teams polished visuals for big-number headlines, percentage callouts, comparative statistics, and the kind of disciplined data-visual communication that turns numbers into narrative.
Use the big-number headline layout for hero-stat slides, the percentage breakdown grid for survey reporting, the side-by-side comparison for category storytelling, and the timeline-of-numbers for longitudinal stat storytelling. Each design balances statistical credibility with the visual energy that big numbers deserve.
Open the file in PowerPoint, Keynote, or Google Slides and update figures, sources, and brand colors in minutes. A solid fit for research briefings, marketing decks, journalism storytelling, classroom data presentations, and any moment when numbers need to land with both clarity and impact.