
Charts and tables
Turn your numbers into a clear chart
Paste a table or a CSV. This chart maker draws it in your presentation’s style.
Switch the chart
Try another chart, keep the numbers
Column, bar, line, area, pie, donut, waterfall and more. The chart redraws in your presentation’s style with every number in place.
- One click to switch, one undo back
- A type that cannot draw your numbers is greyed, with the reason
- Every chart type in every look
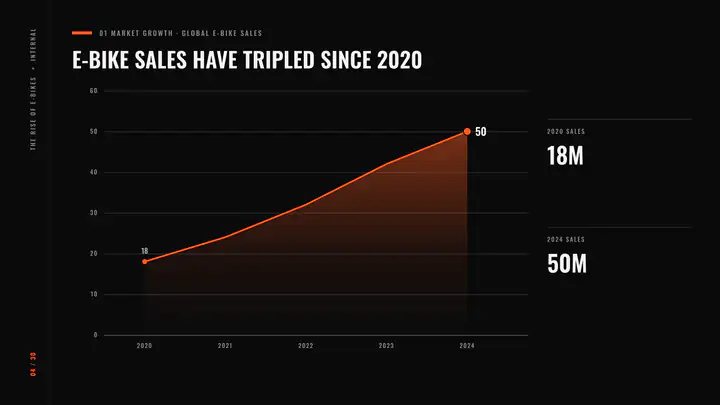
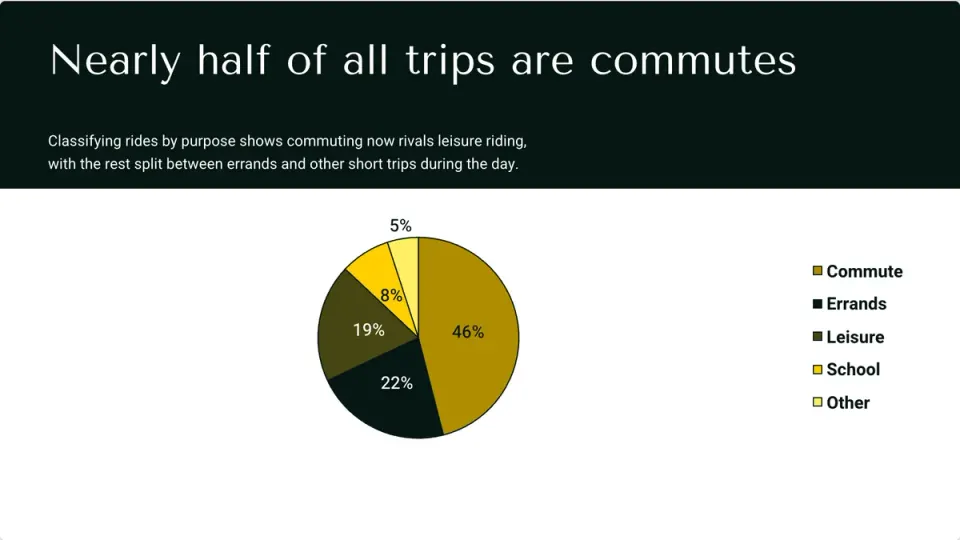
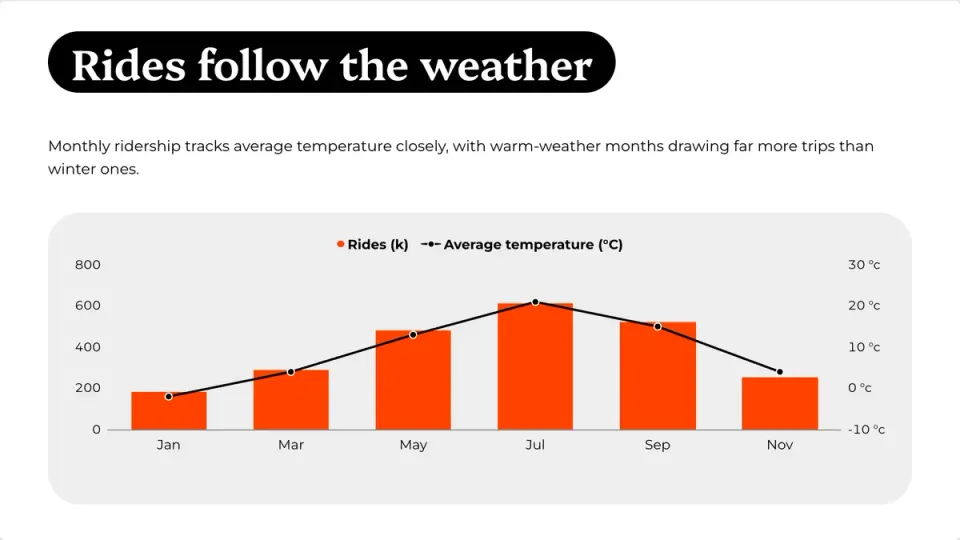
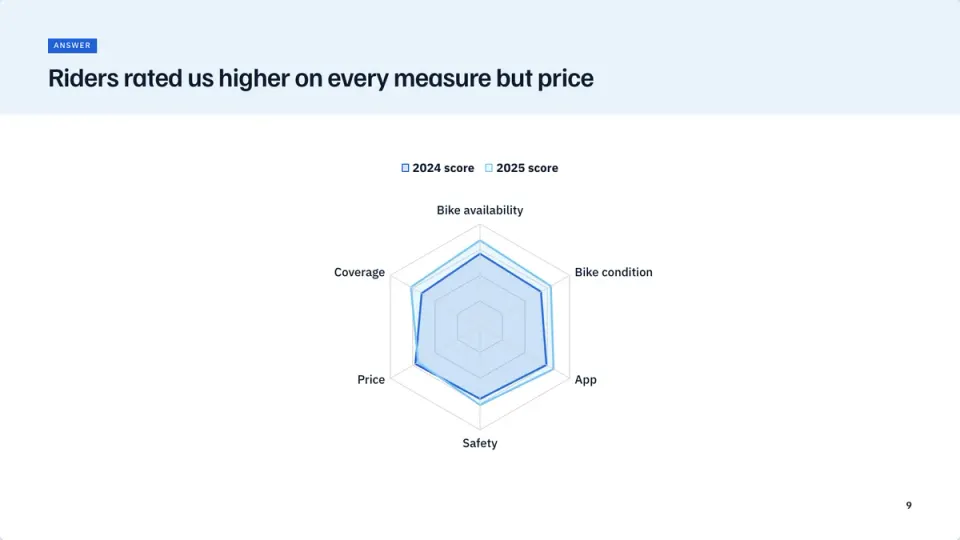
Ask for it
Describe the chart and it is drawn
Ask for “a pie chart of our market share” or “slide 4 as a line chart”. The type you name is drawn whenever your numbers fit it.
- By chat or by voice
- Your numbers, not made-up ones
- A title, a takeaway and a source on every chart

Tables
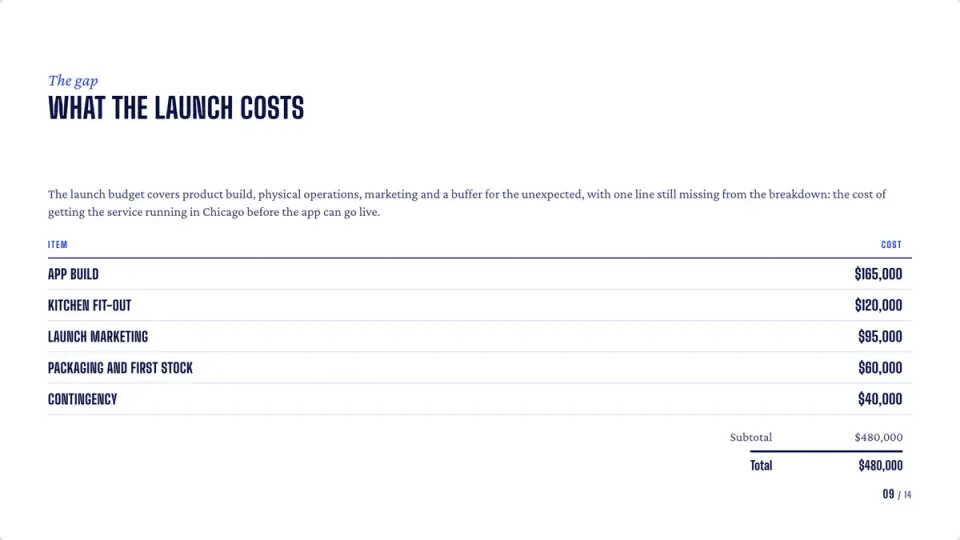
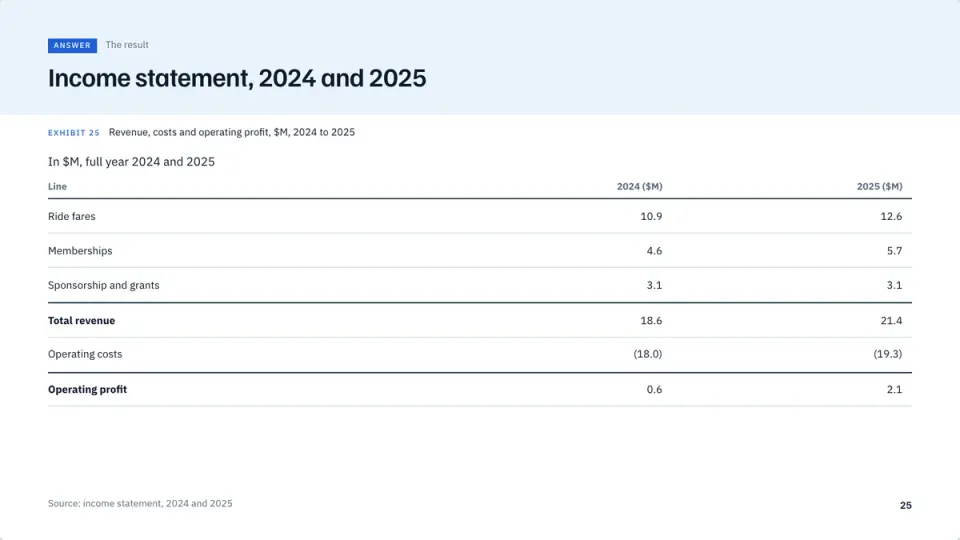
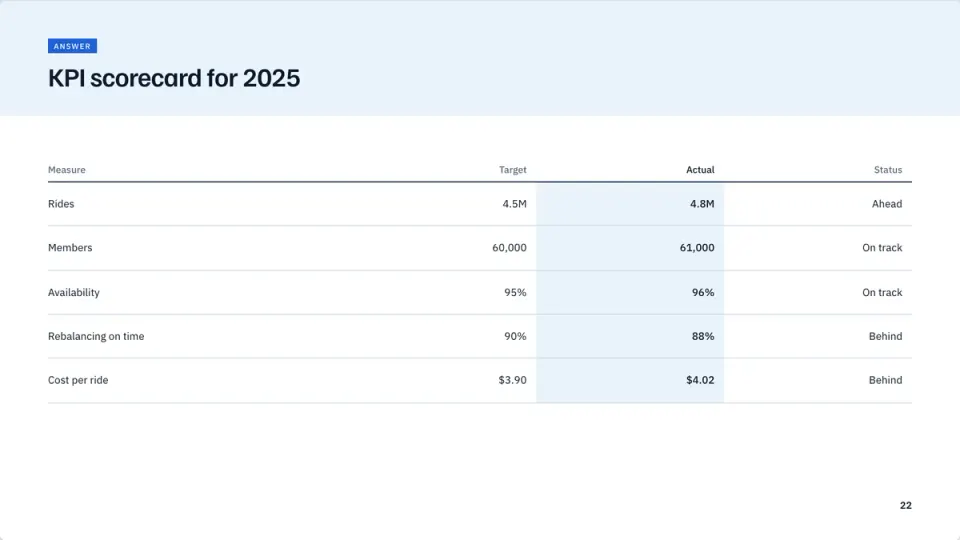
Tables that add themselves up
Turn on totals and the money column is summed with the local tax and a total. A table longer than ten rows continues on the next slide.
- Tax names and rates by country
- A CSV goes in exactly as it is
- Native PowerPoint tables on paid plans

In PowerPoint
Charts you can still edit in PowerPoint
On a paid plan, download the presentation and every chart is a PowerPoint chart. Click Edit Data and your numbers are there.
- Native charts and tables
- Your colors in PowerPoint’s picker
- Downloads on the paid plans

How it works
Three steps
- Step 1
Bring your numbers
Type them, paste a table, or attach a CSV.
- Step 2
Pick a chart
Choose one, or let the writer pick from the shape of your data.
- Step 3
Switch any time
Change the type in one click. The numbers stay.
Questions
Questions, answered
Which chart types are there?
Column, stacked column, bar, stacked bar, line, area, pie, donut, scatter, bubble, radar, waterfall, Marimekko, combo, Pareto, range, funnel and Sankey, in every look.
Can I use a spreadsheet?
Attach a CSV or TSV file, or paste the table. From Excel, save the sheet as CSV first.
Are the charts editable in PowerPoint?
Yes. Every chart downloads as a native PowerPoint chart with its data. Downloads are on the paid plans.
Can I change the chart type later?
Yes, by a click or by asking the assistant. Every number stays.
Have your report’s charts ready by lunch
Each chart gets a title, a takeaway and its source. Switch the type and every number stays.