
For marketing teams
Show your boss campaign results that impress
Infograpia makes AI presentations for marketing. Paste the brief and numbers to get results charts and launch plans.

Launch plans
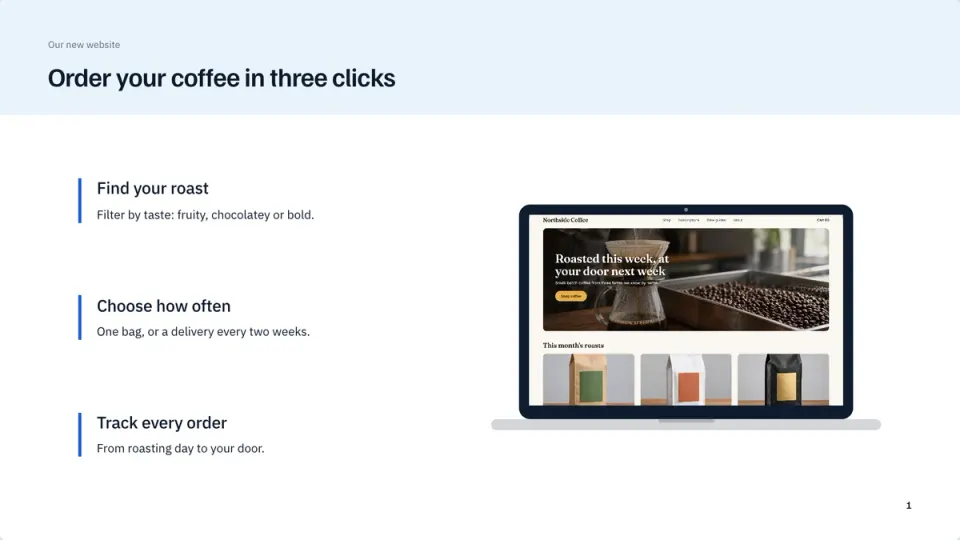
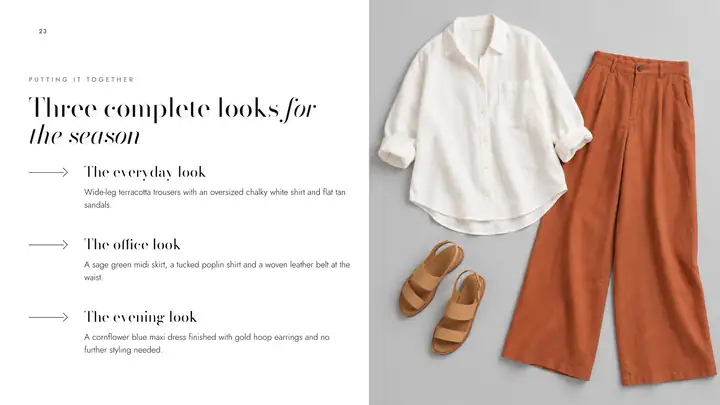
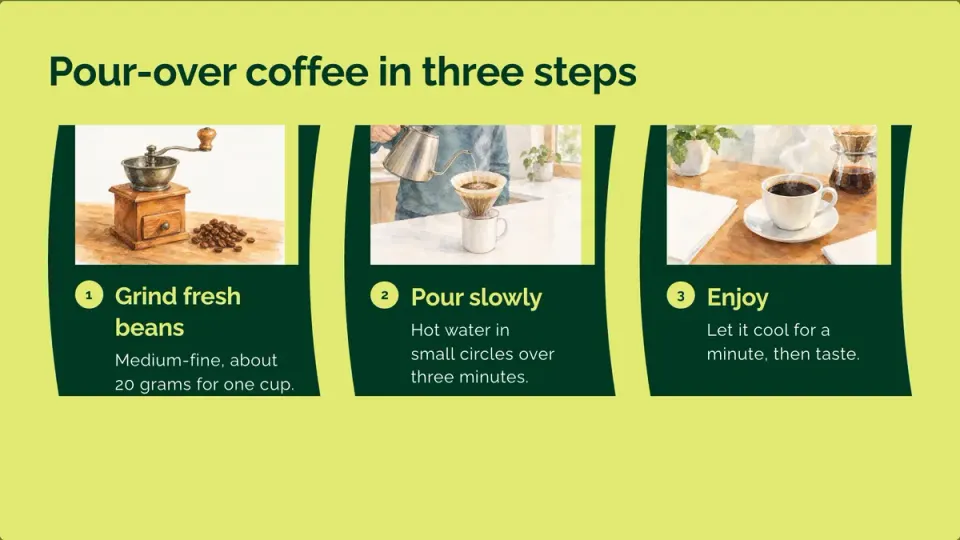
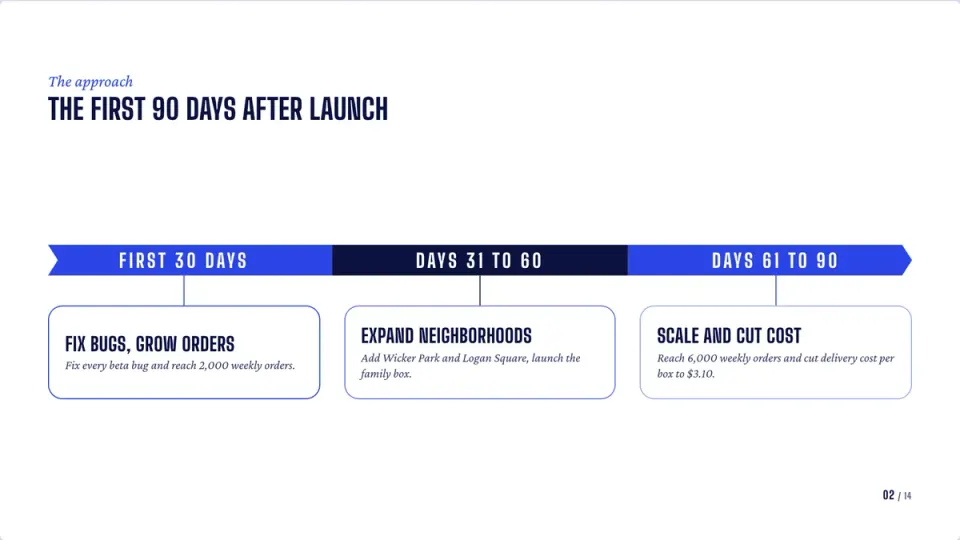
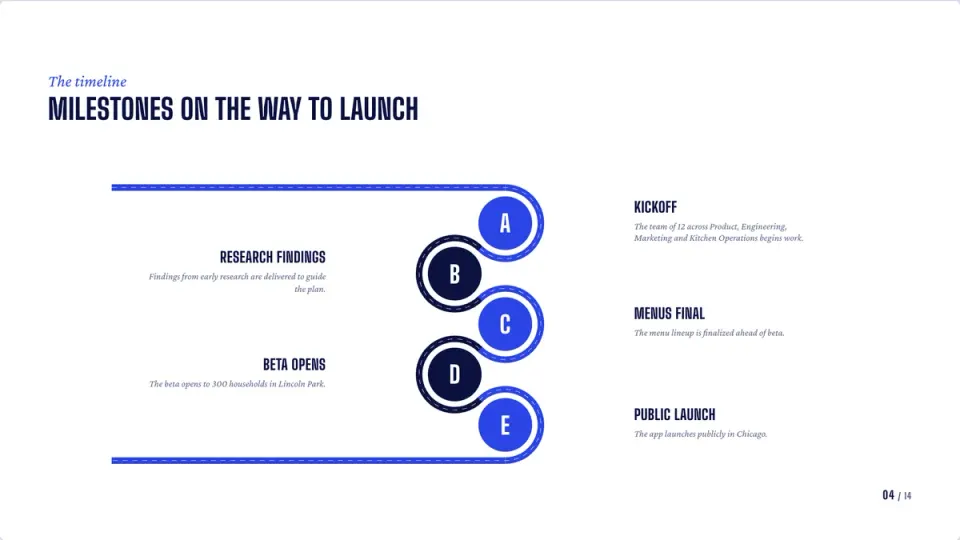
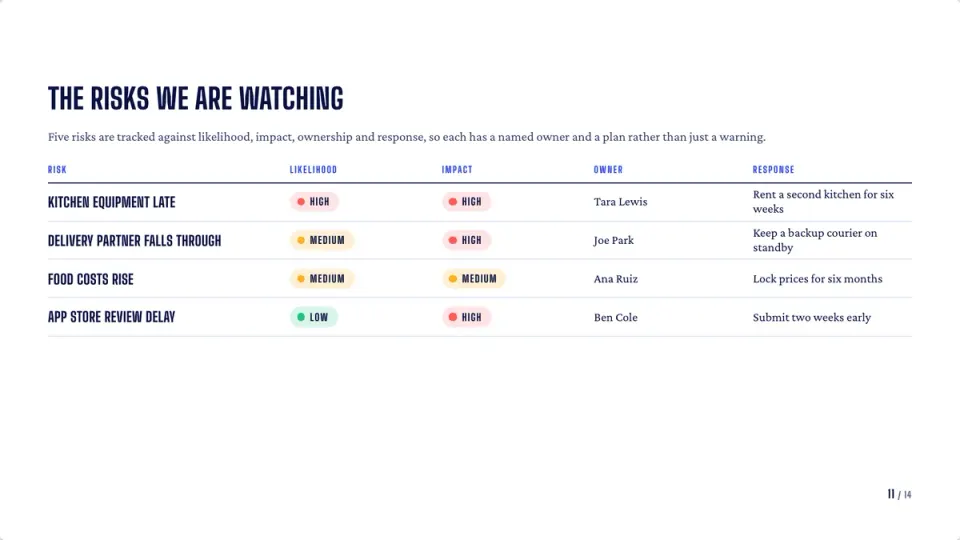
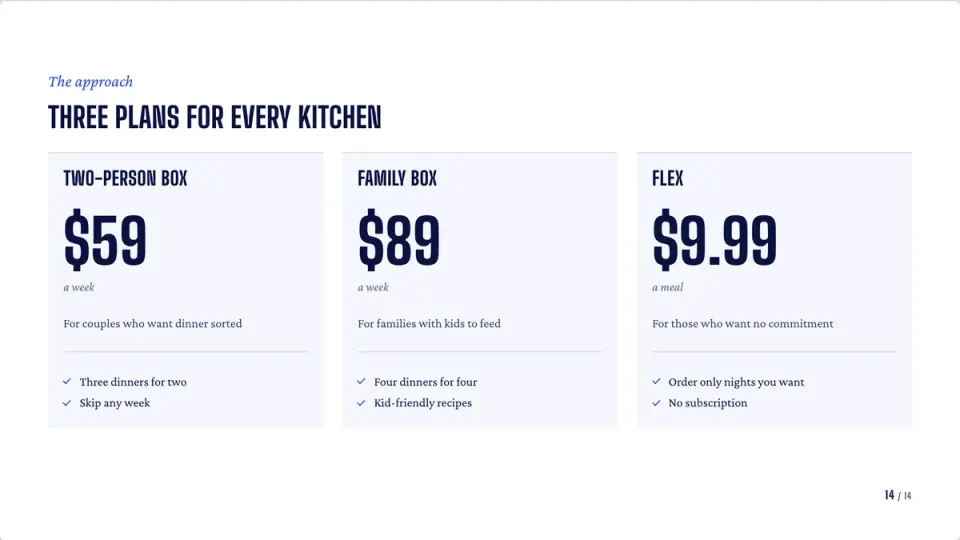
Launch plans with every part in place
The phases, the routes to market, the customers who decide and the risks with their answers, written from your brief.
- Phases and owners
- Risks with their answers
- Your brand, on any plan
Results
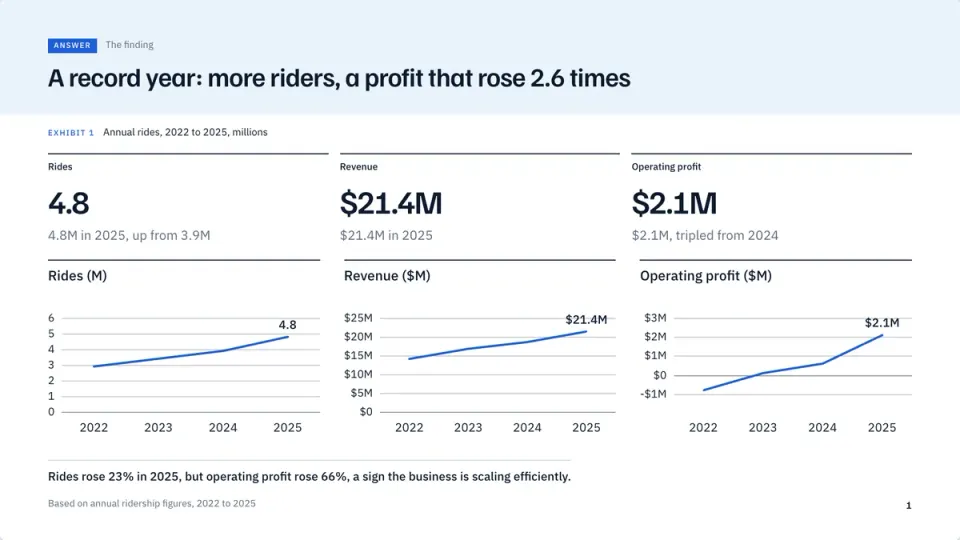
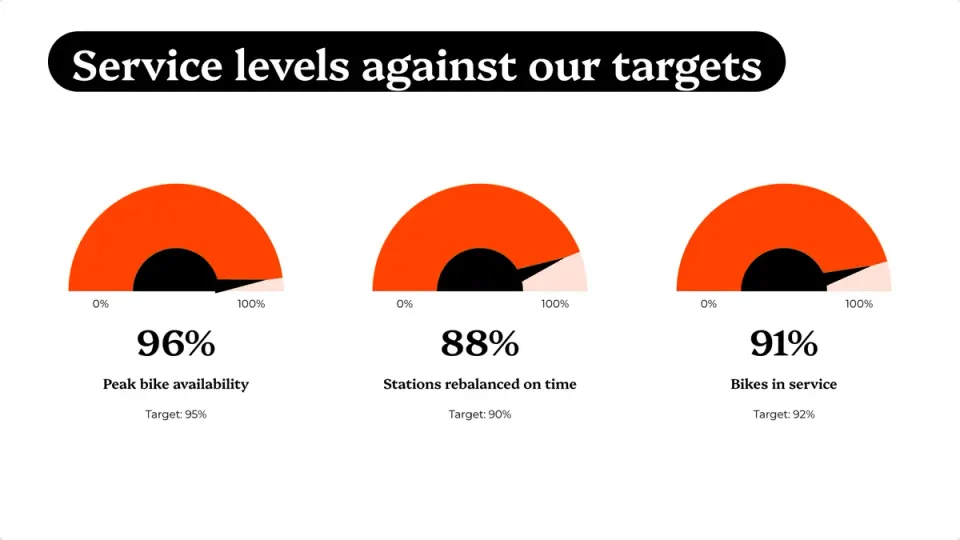
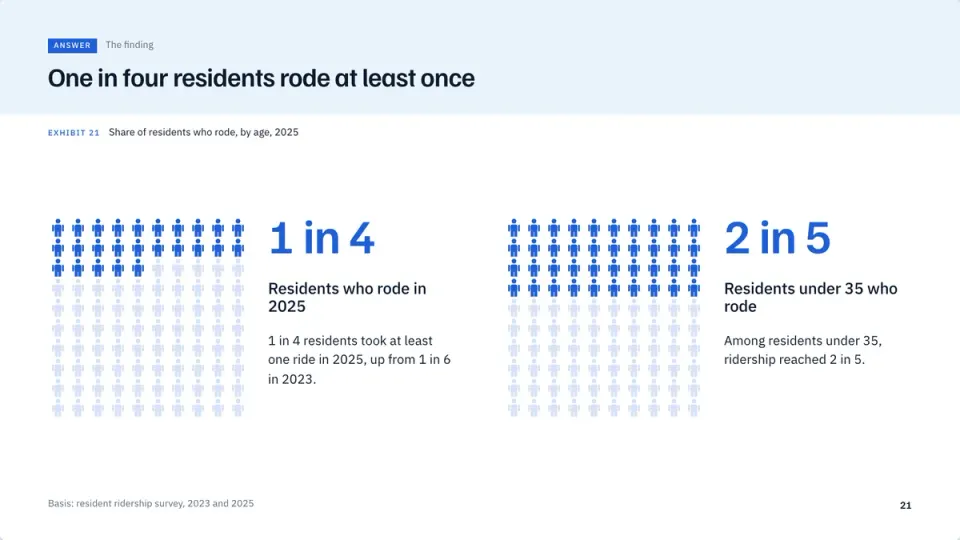
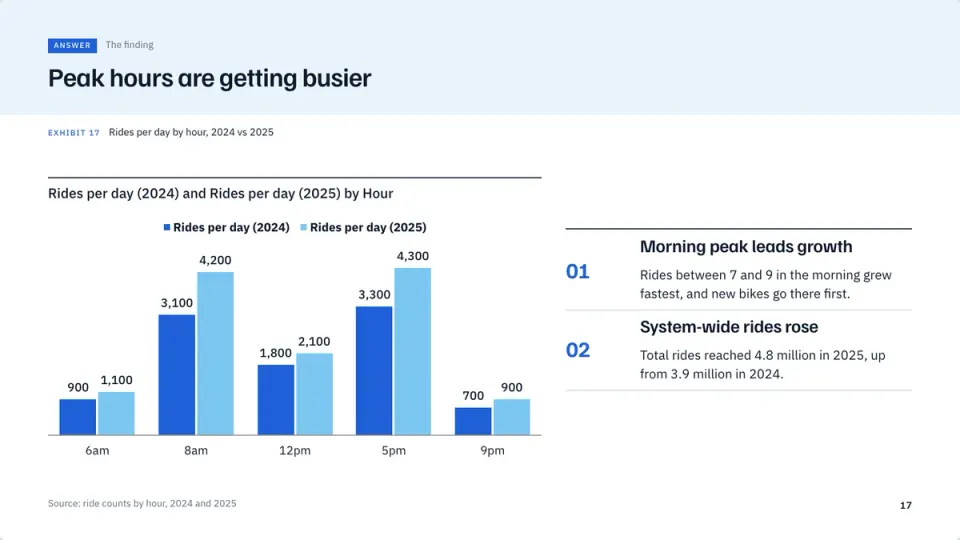
Campaign numbers as charts
Paste your results or attach a CSV, and pick the chart. Switch the type in one click and the numbers stay.
- Column, line, pie and more
- Funnels, dashboards and timelines
- Native PowerPoint charts on paid plans
Pictures
Pictures made for the campaign
Pick a style, from photograph to flat illustration, and every picture is made for its slide.
- Not stock photos
- Change one in words
- Or upload your own
 Photograph
 Cinematic
 Studio
 Cartoon
 Flat illustration
 Isometric
 3D clay
 Watercolor
 Line sketch
Every market
Every market, in its own language
Translate the whole presentation for another market in one pass. The designs and pictures stay as they are.
- Spanish, French, German and more
- One request
- Present it the same day

How it works
Three steps
- Step 1
Paste the brief
The launch, the audience and your numbers, or attach the plan.
- Step 2
Pick a look
Or wear your brand kit.
- Step 3
Present or share
From the browser, as a link, or as a PowerPoint on a paid plan.
Questions
Questions, answered
Can it make a launch plan from our brief?
Yes. Describe the launch, add your figures or attach the plan, and it writes the presentation: the timeline, the funnel, the customer and the ask.
Can we use our brand?
Yes, on every plan. Add your logo, colors and fonts once and every presentation wears them.
Can the team edit it in PowerPoint?
Yes. Download a PowerPoint with real text, shapes and native charts. Downloads are on the paid plans.
Can I share it without sending a file?
Yes. Turn on Share to web and send the link; it opens on any screen.
Make every campaign review look polished
Drop in last month’s numbers and every chart is drawn for you, with the takeaway already written.