
For consultants
Spend your time on advice, not slides
Infograpia makes AI presentations for consultants. Add the client’s report to get charts, risk maps and a recommendation.
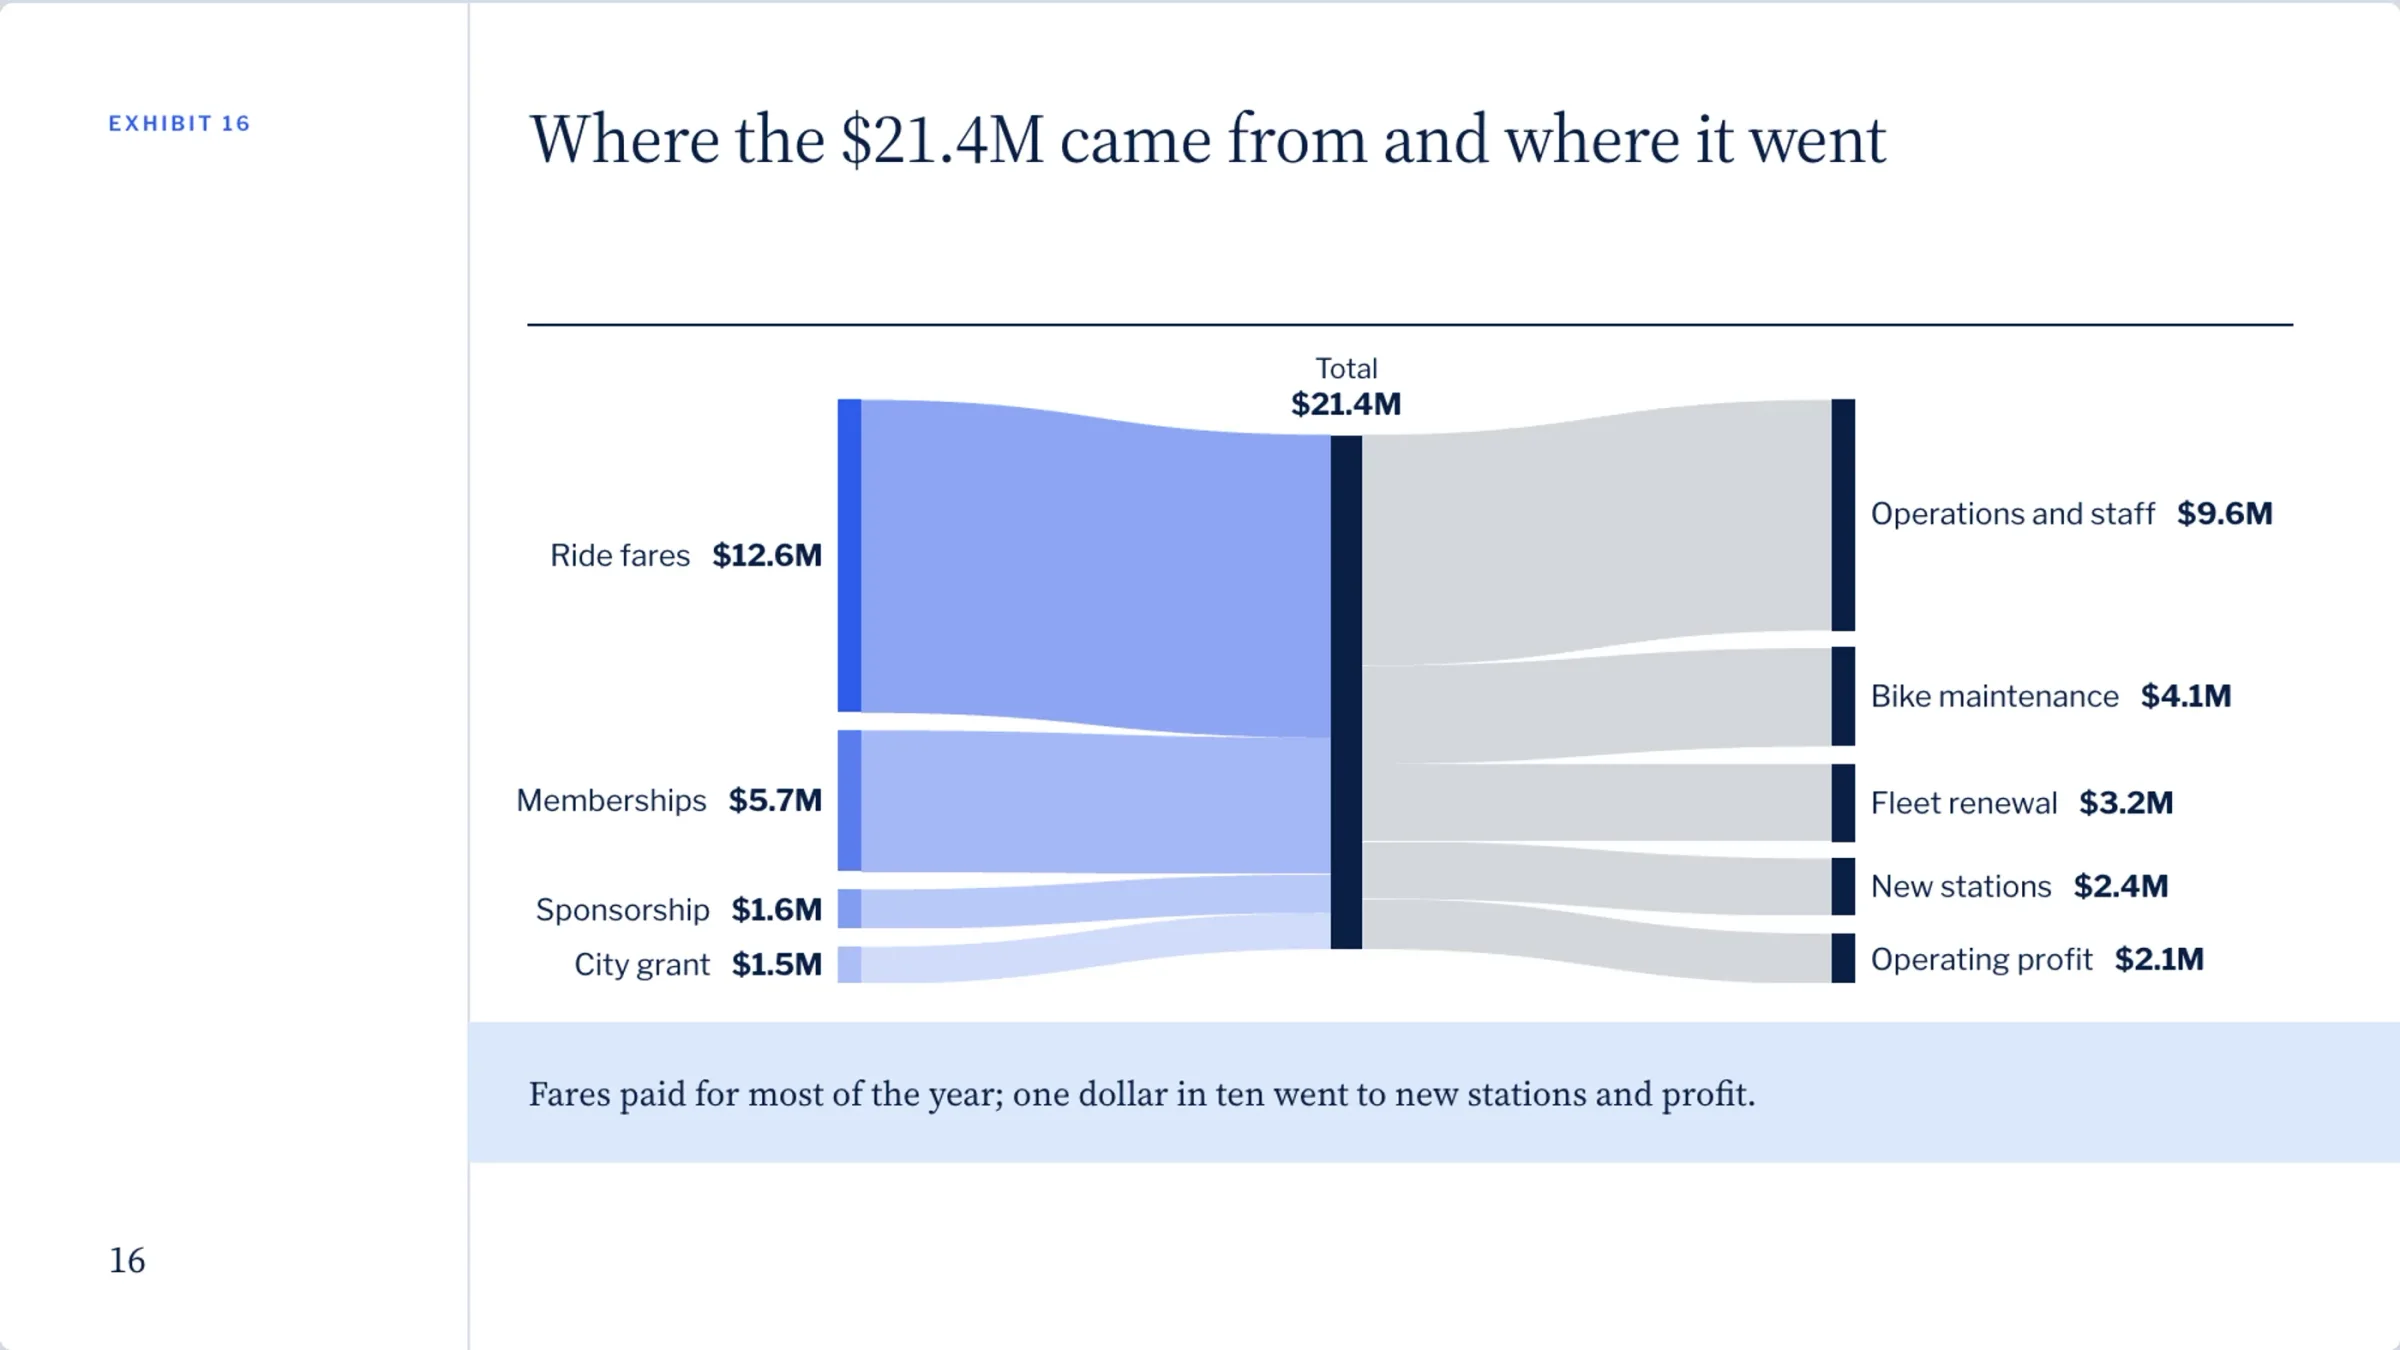
From the documents
The client’s figures, not filler
Attach the client’s PDF, a Word report or a CSV, and the slides are written from them, every figure kept.
- PDF, Word, PowerPoint, CSV
- Tables become charts
- Anything cut is said
Frameworks
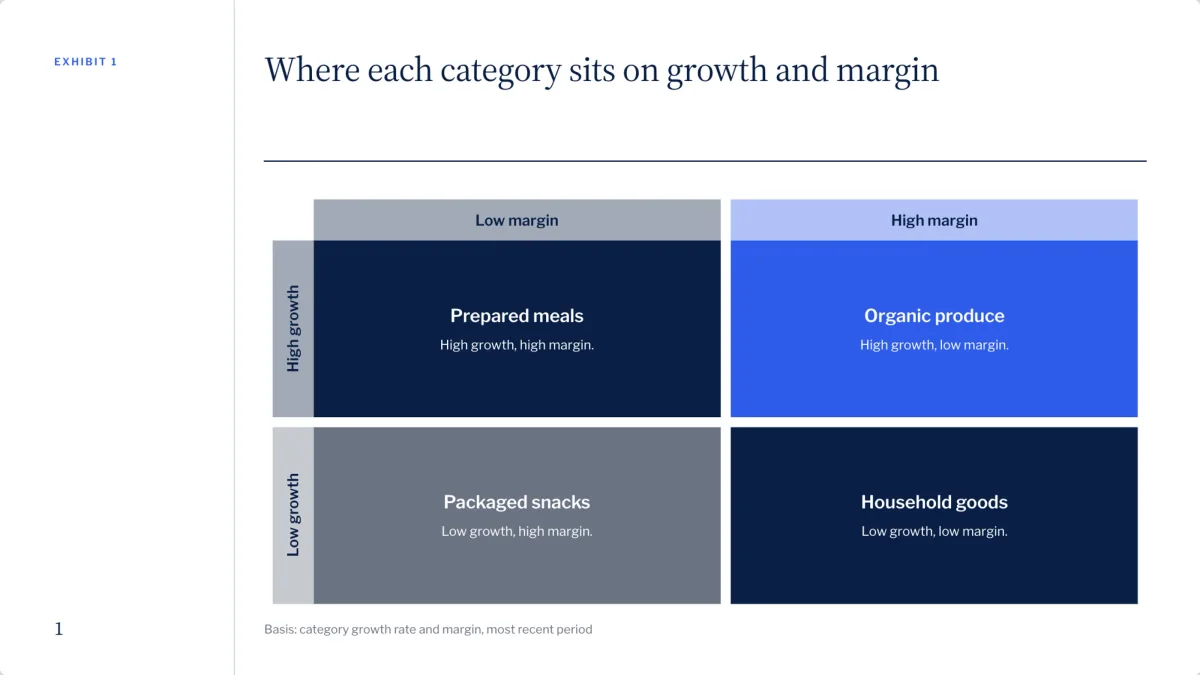
The frameworks you already use
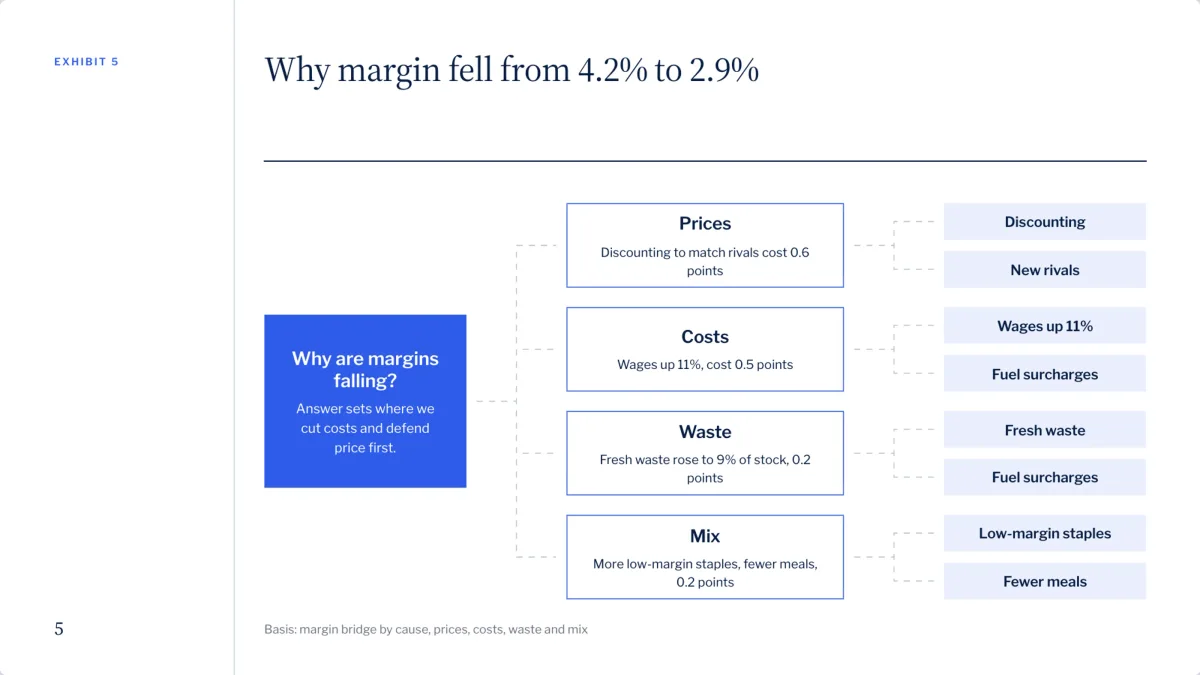
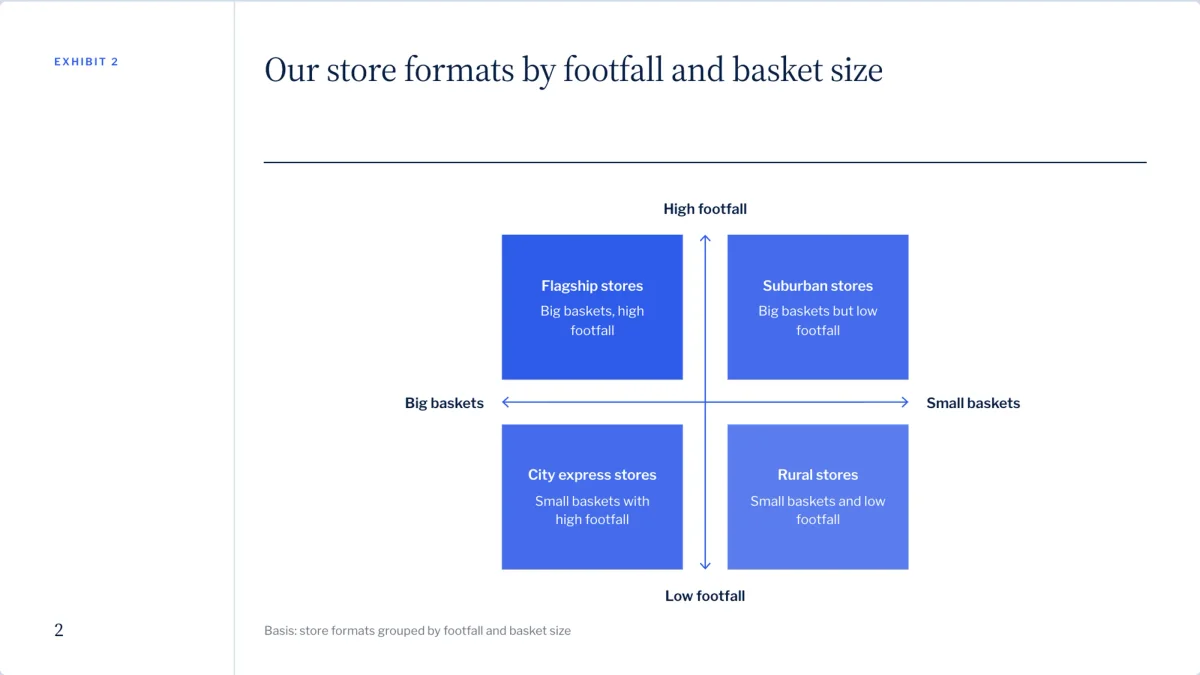
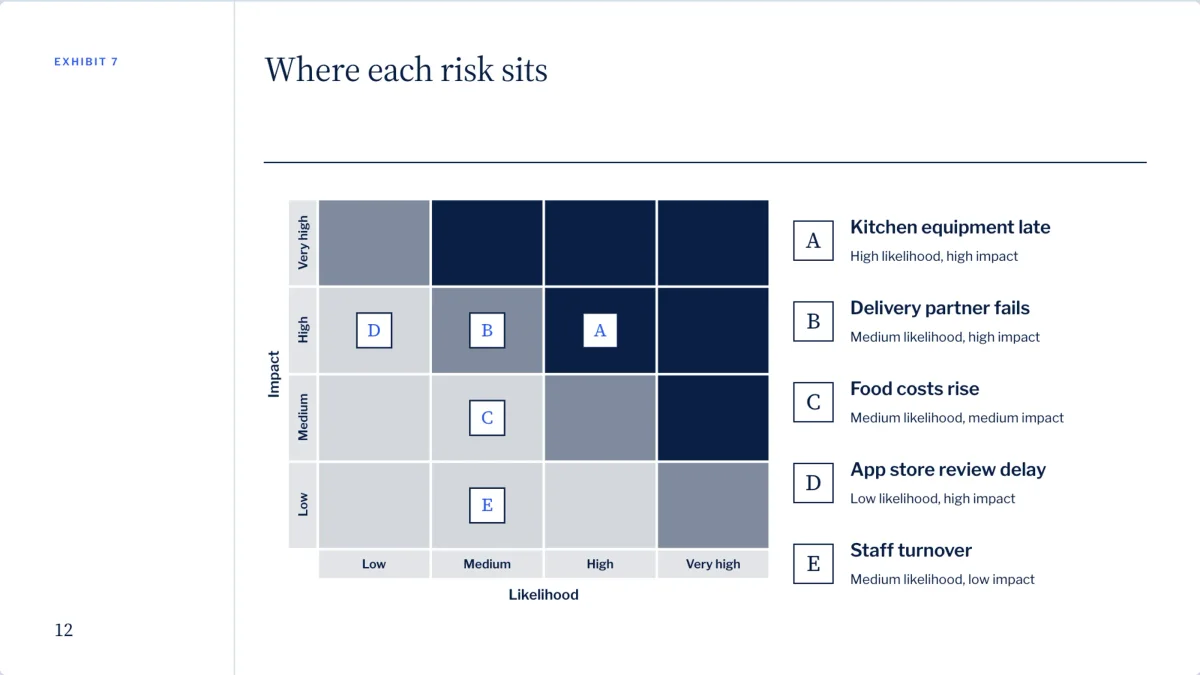
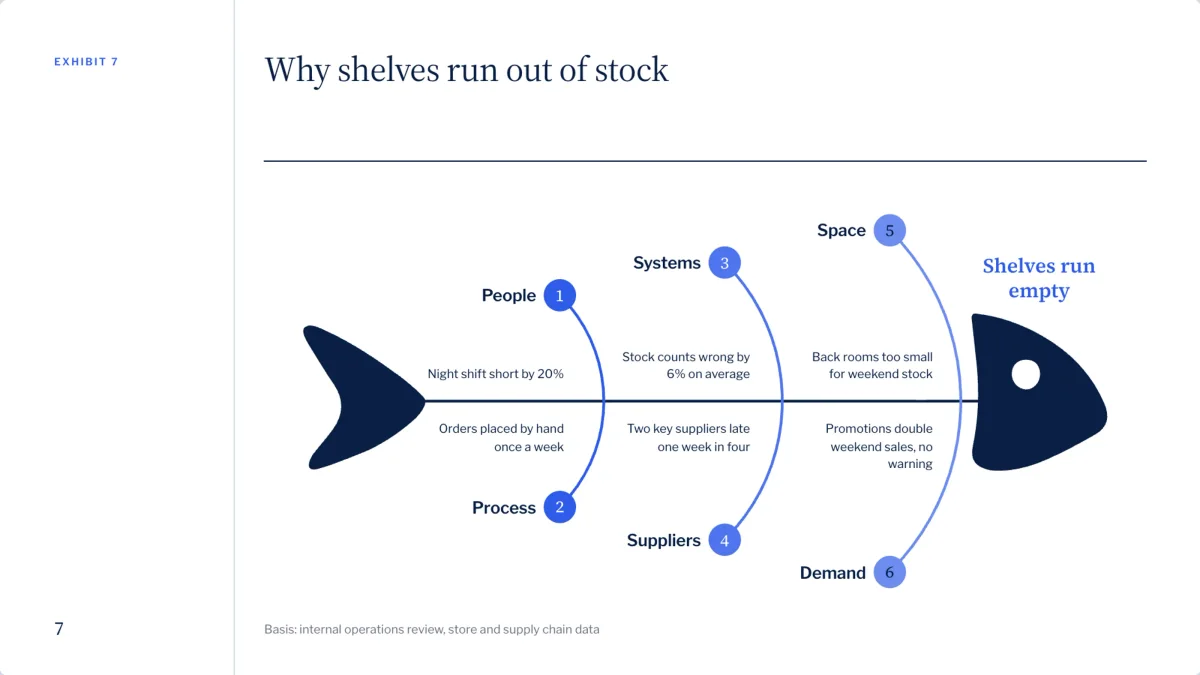
Issue trees, 2x2 matrices, SWOT, risk heat maps, Harvey balls, Gantt timelines, waterfalls and more, in one consistent style.
- Drawn in your presentation’s style
- Redrawn when you add a part
- Editable PowerPoint shapes on paid plans
Exhibits
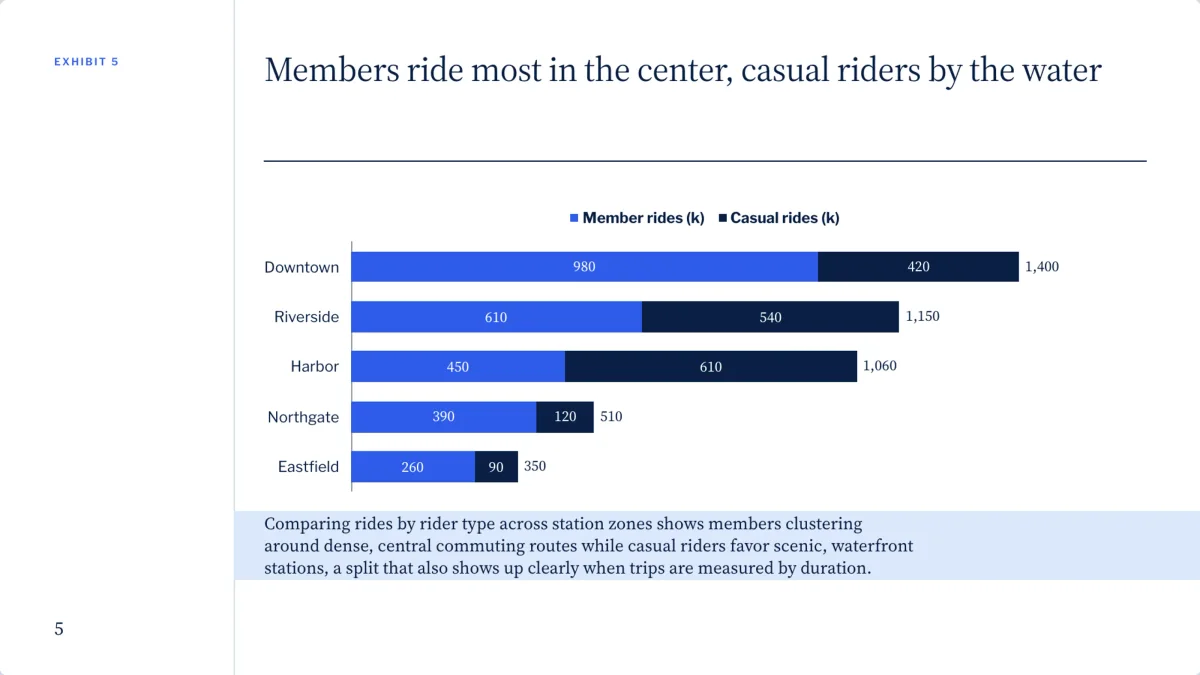
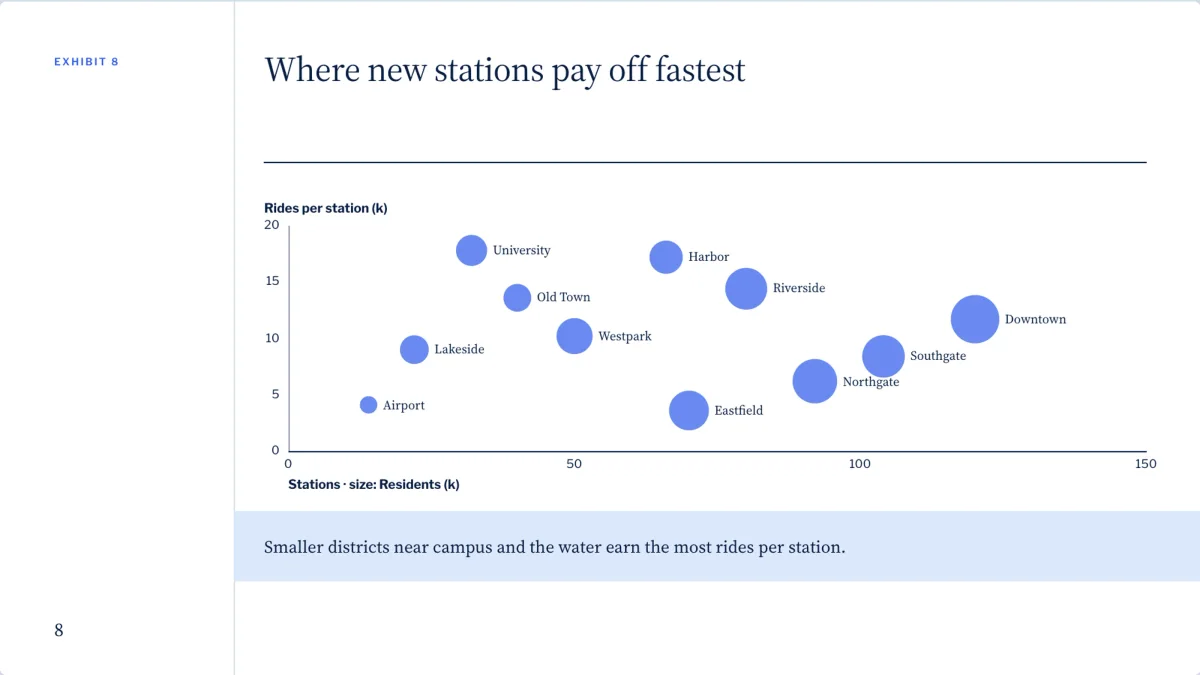
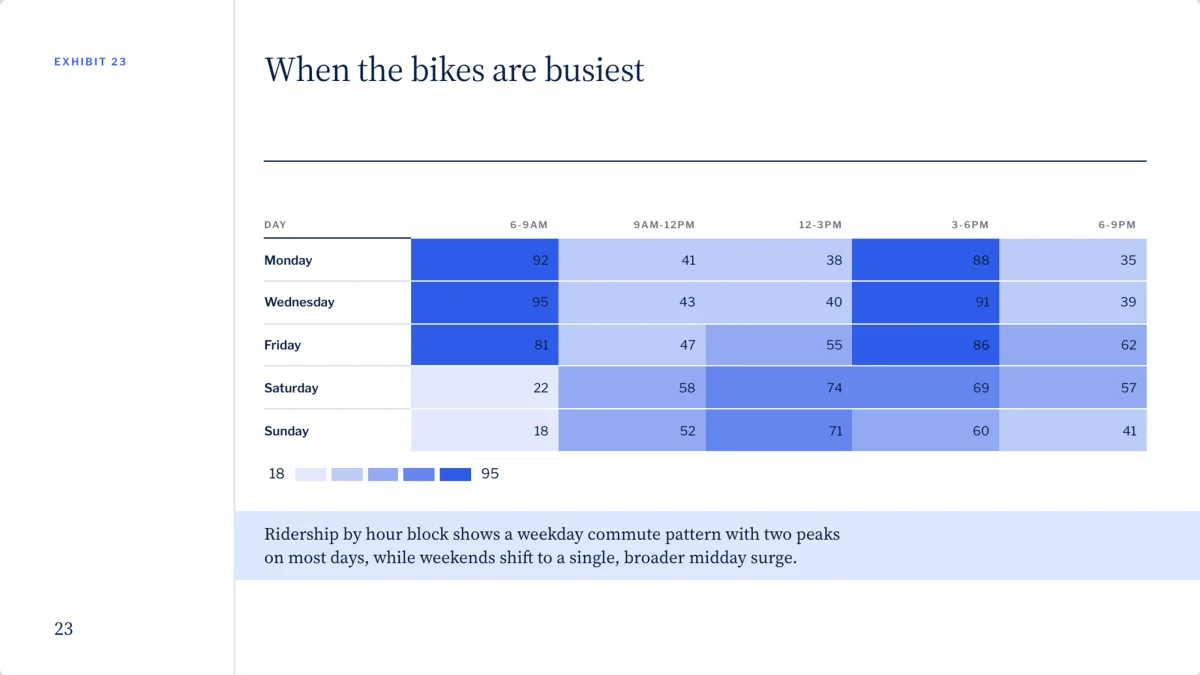
Every chart with its takeaway
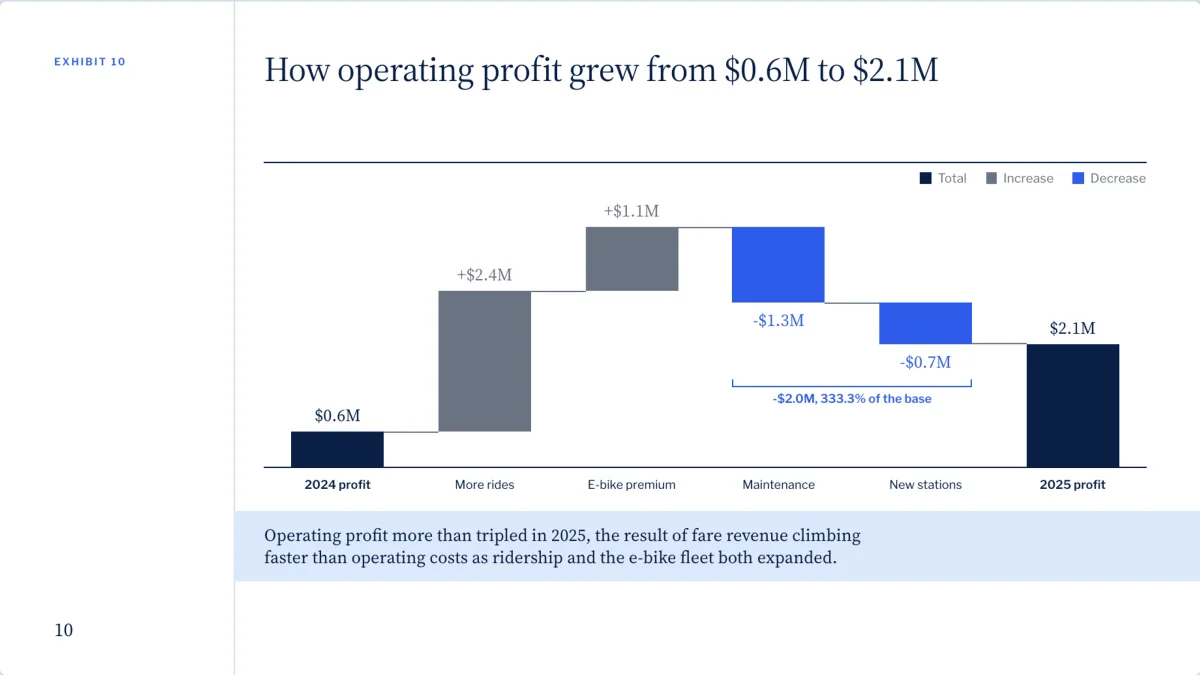
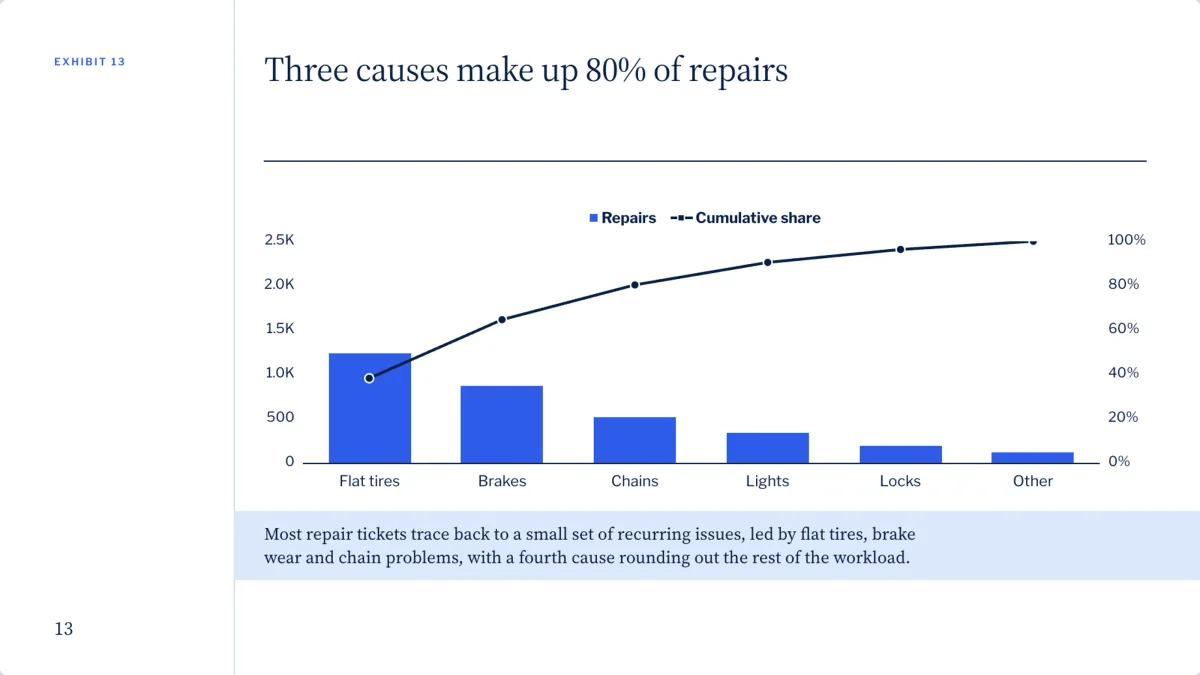
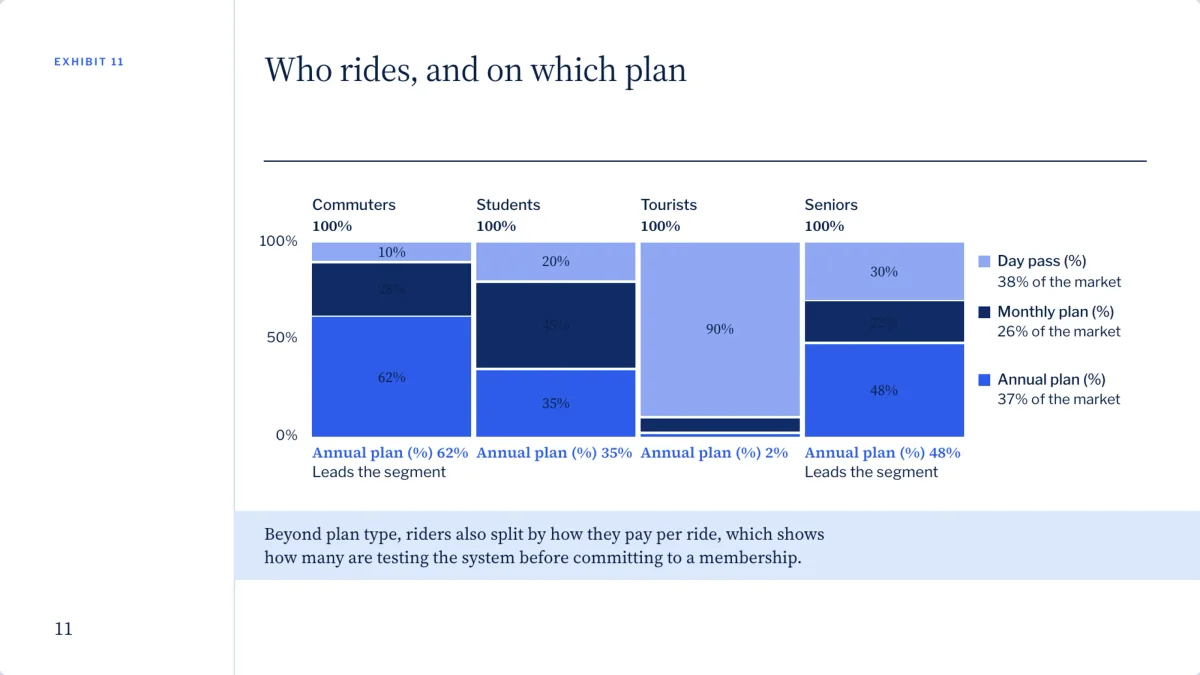
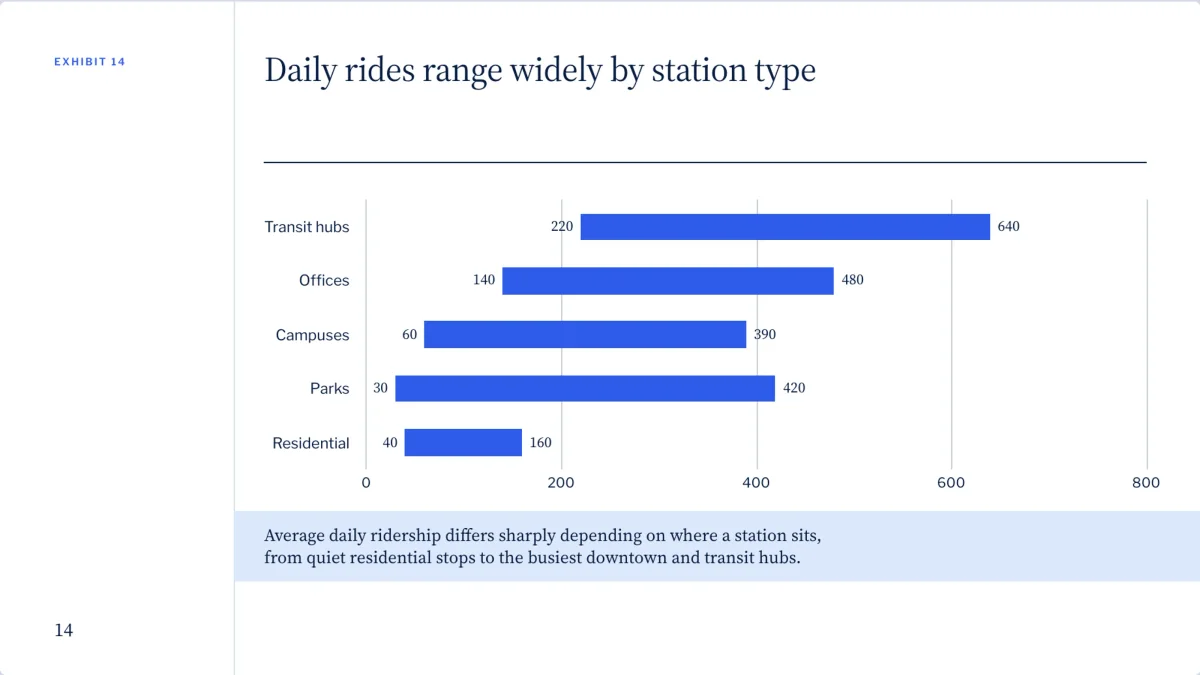
Each chart carries a title, a one-line takeaway and its source. Switch the type and the numbers stay.
- Switch the type in one click
- Waterfall, Pareto, Marimekko
- Native PowerPoint charts on paid plans
How it works
Three steps
- Step 1
Attach the material
Your notes, the client’s documents, the data as CSV.
- Step 2
Say who it is for
The steering committee, the board, the team.
- Step 3
Refine and hand over
Ask for changes, then share a link, or download the PowerPoint on a paid plan.
Questions
Questions, answered
Is client material private?
Yes. Your presentations stay in your account until you share a link.
Can it build a waterfall or a Pareto chart?
Yes. Both are on the chart menu, with Marimekko, combo and Sankey.
Can I use the client’s brand?
Yes, on every plan: set their logo, colors and fonts in the brand kit and every slide wears them.
Can I deliver it in another language?
Yes. Translate the whole presentation in one pass, designs and pictures kept.
Clients will ask who made your slides
Paste your notes and the client’s data. The slides use your frameworks and the client’s brand.