
Infographics
Turn bullet points into a clear diagram
Paste your list or describe the steps. This infographic maker draws a timeline, flowchart or roadmap.
Timelines and roadmaps
Plans on a calendar
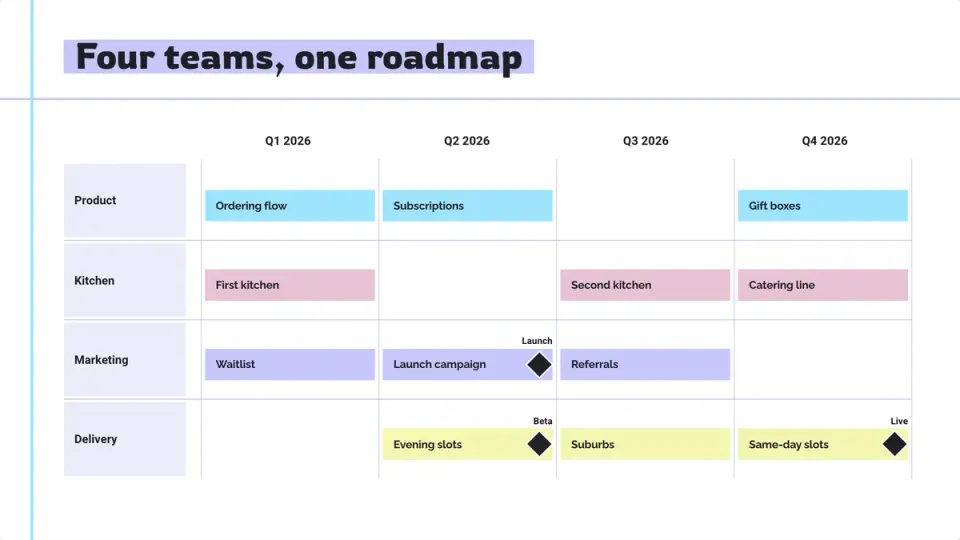
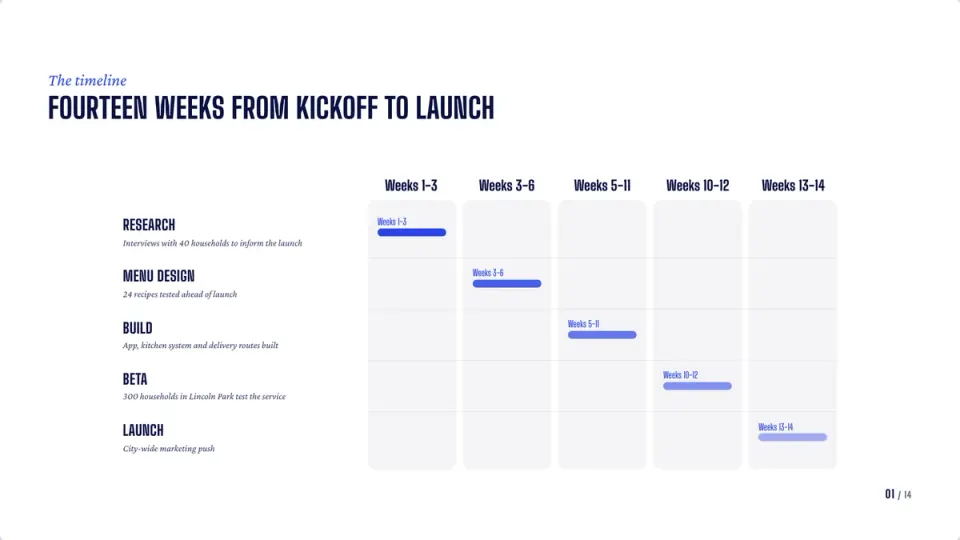
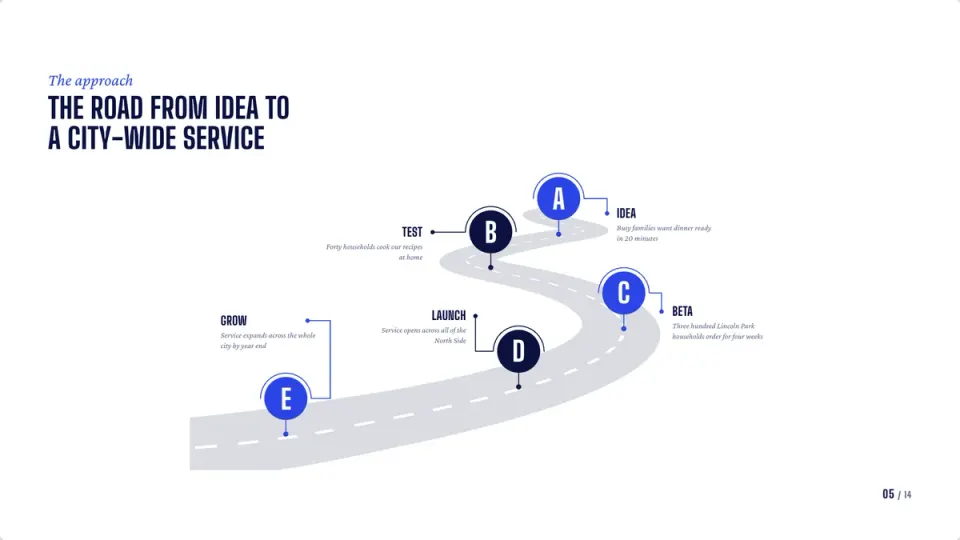
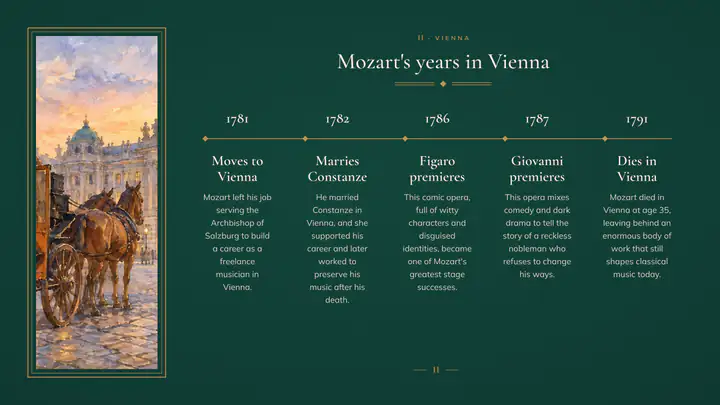
Gantt timelines and swimlane roadmaps by quarter, each bar on its dates, with milestones and a line for today. No dates? A winding road.
- Lanes for each team
- Up to twelve steps
- Each bar’s dates edited on the slide
Flowcharts
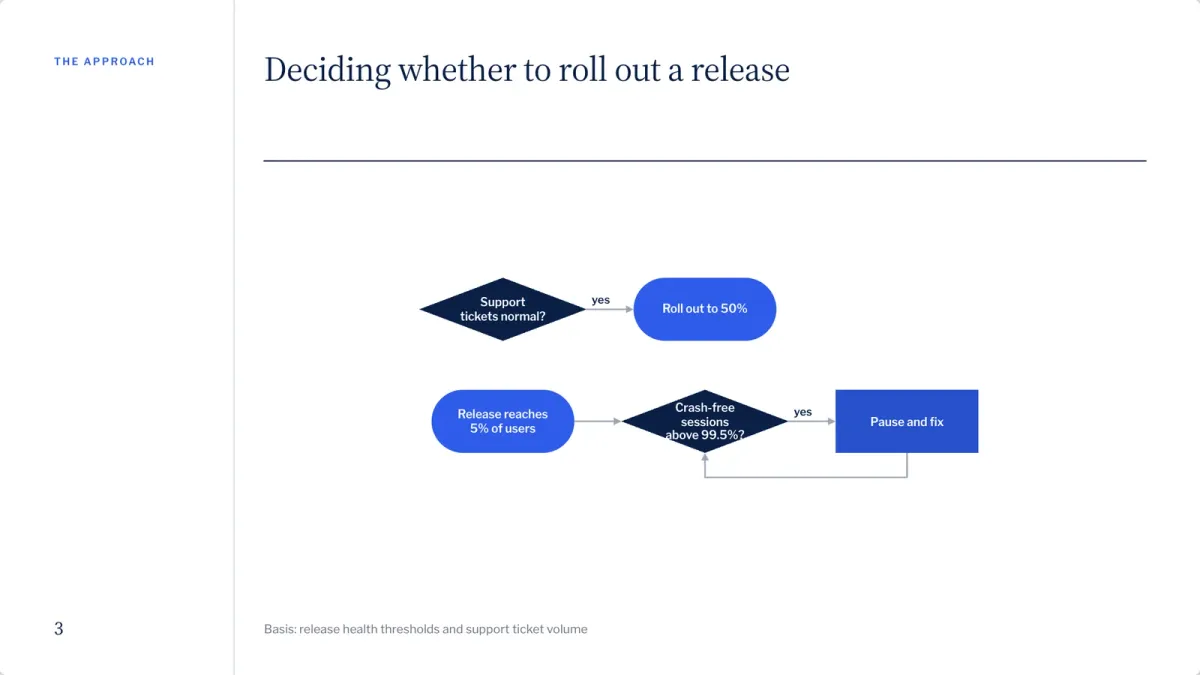
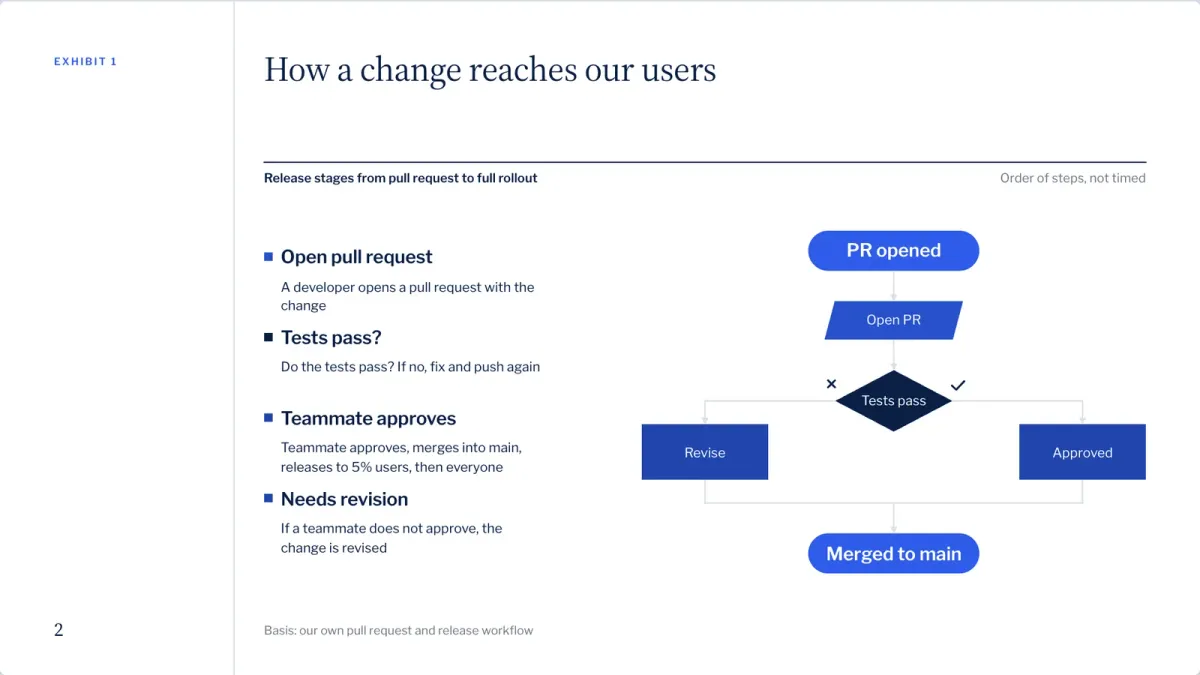
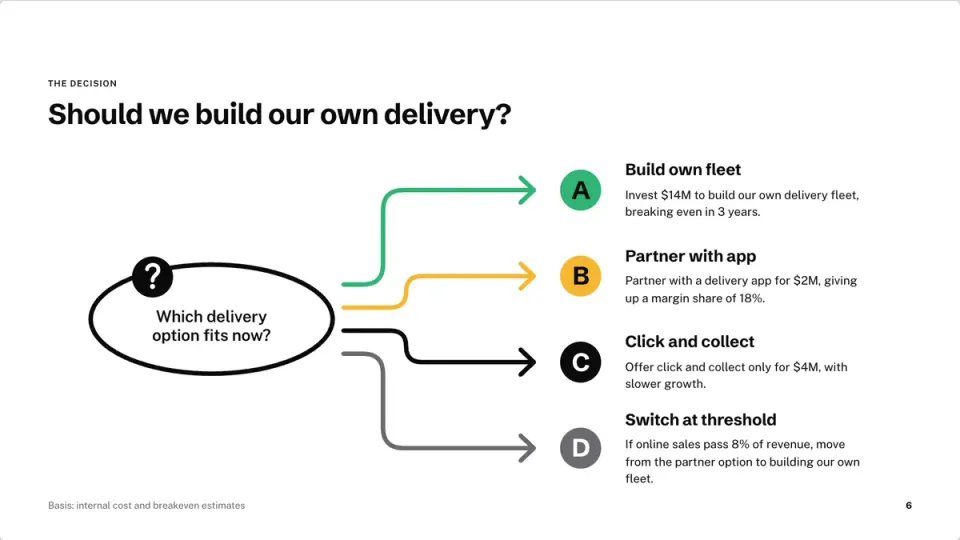
Flowcharts that lay themselves out
Steps, questions, loops and lanes for who does what. Ask to add a box and the chart redraws around it.
- Three to twelve boxes
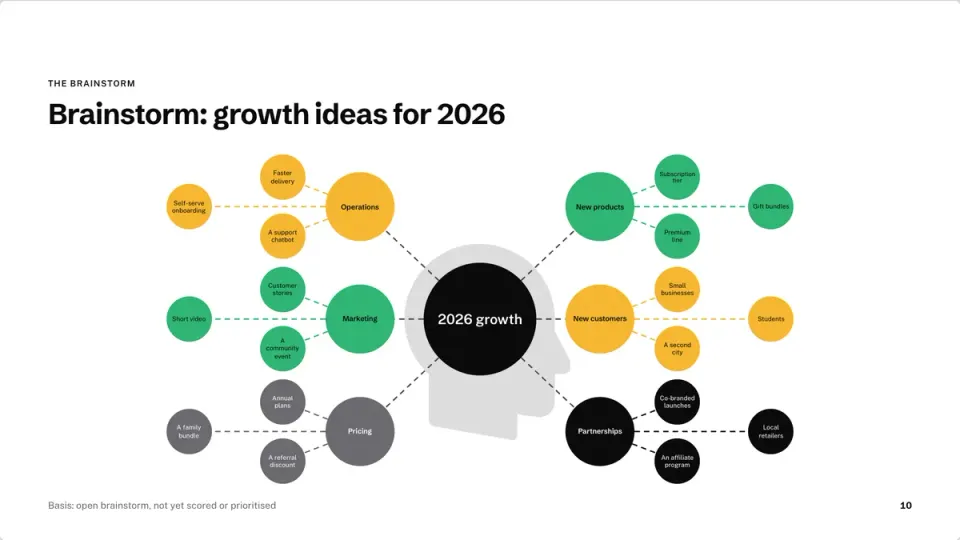
- Mind maps too
- PowerPoint shapes and connectors on paid plans
Maps
Maps from place names
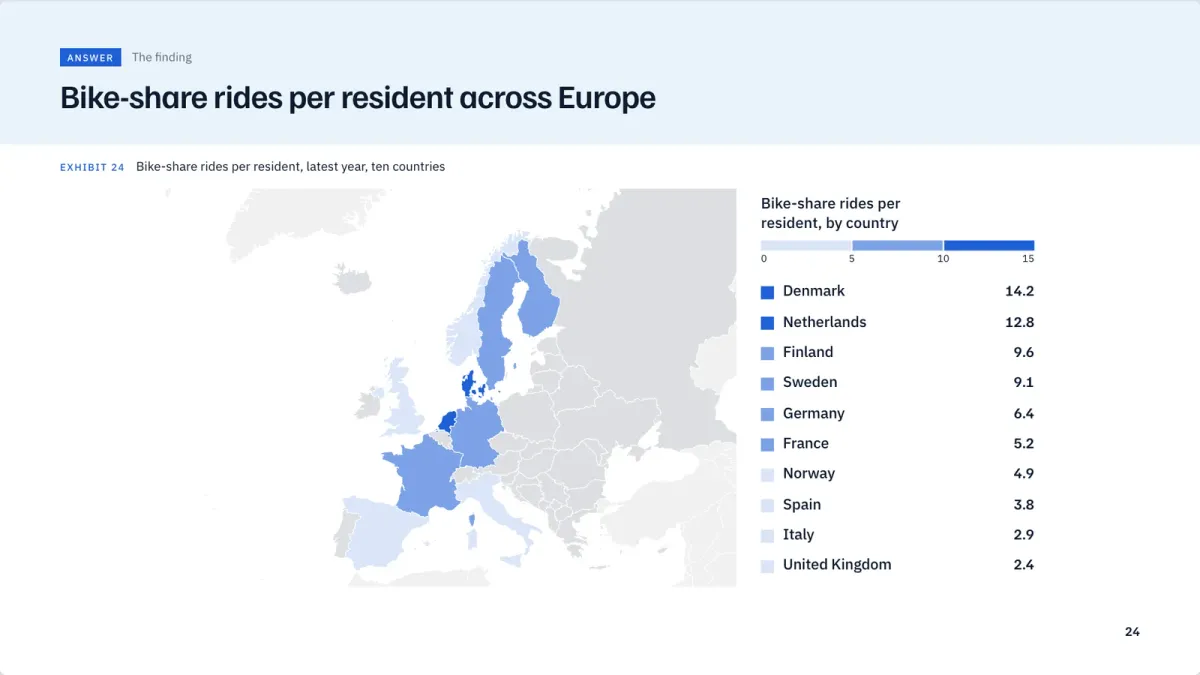
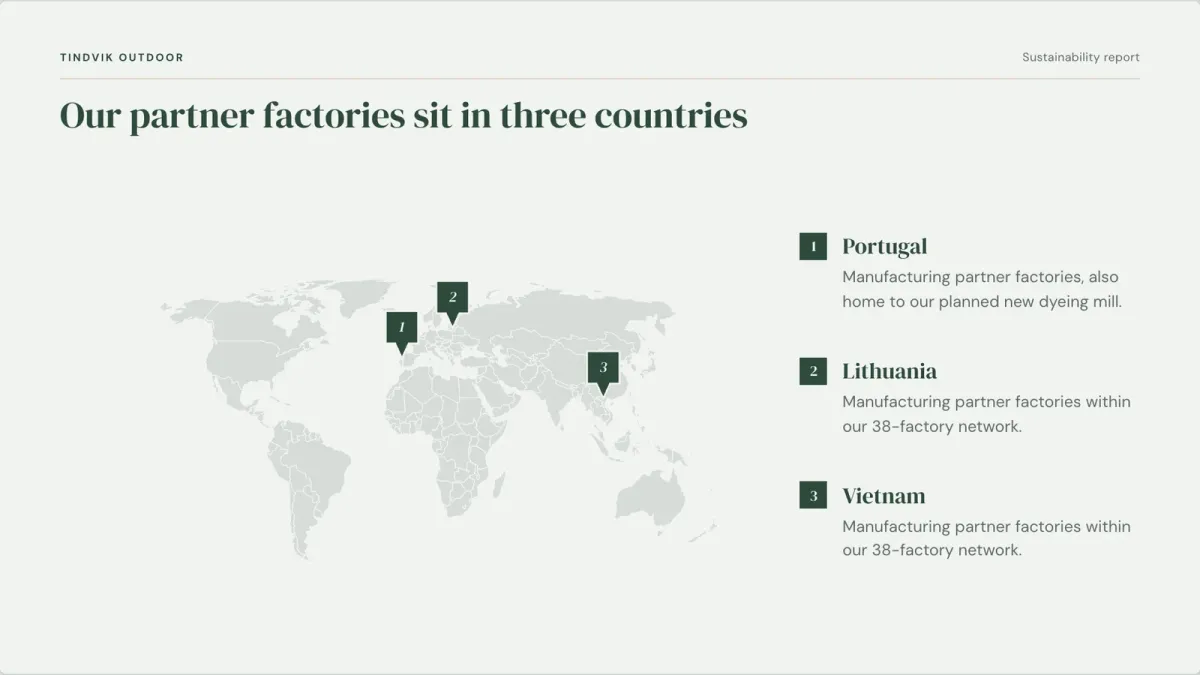
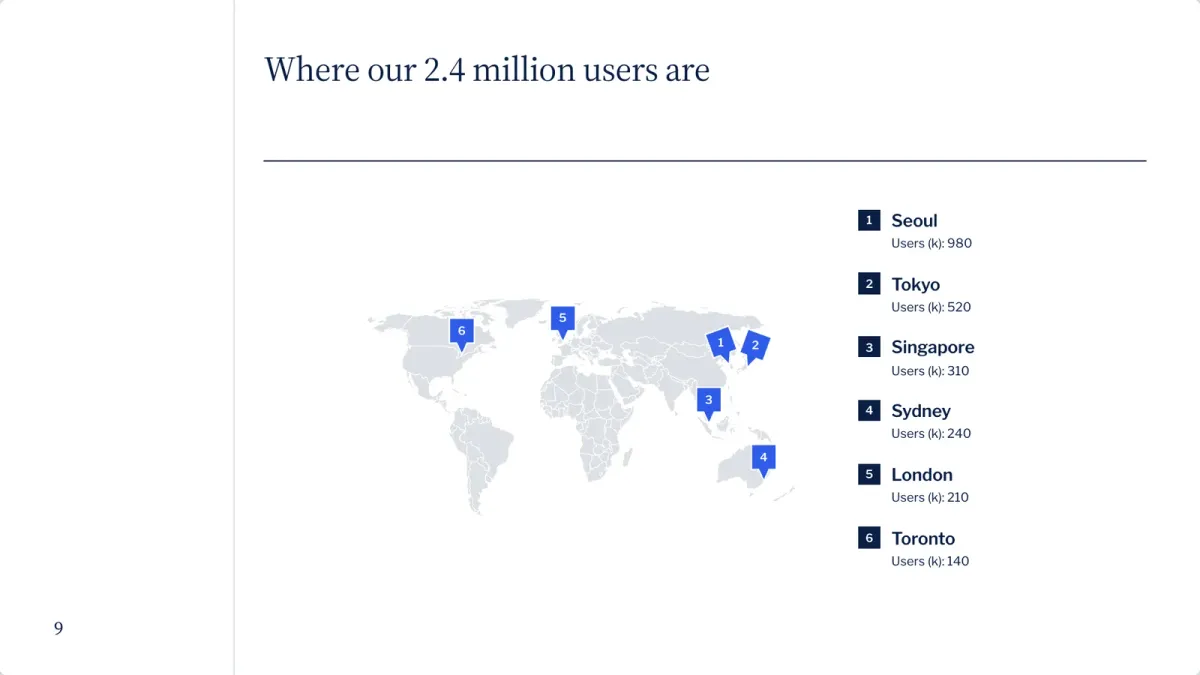
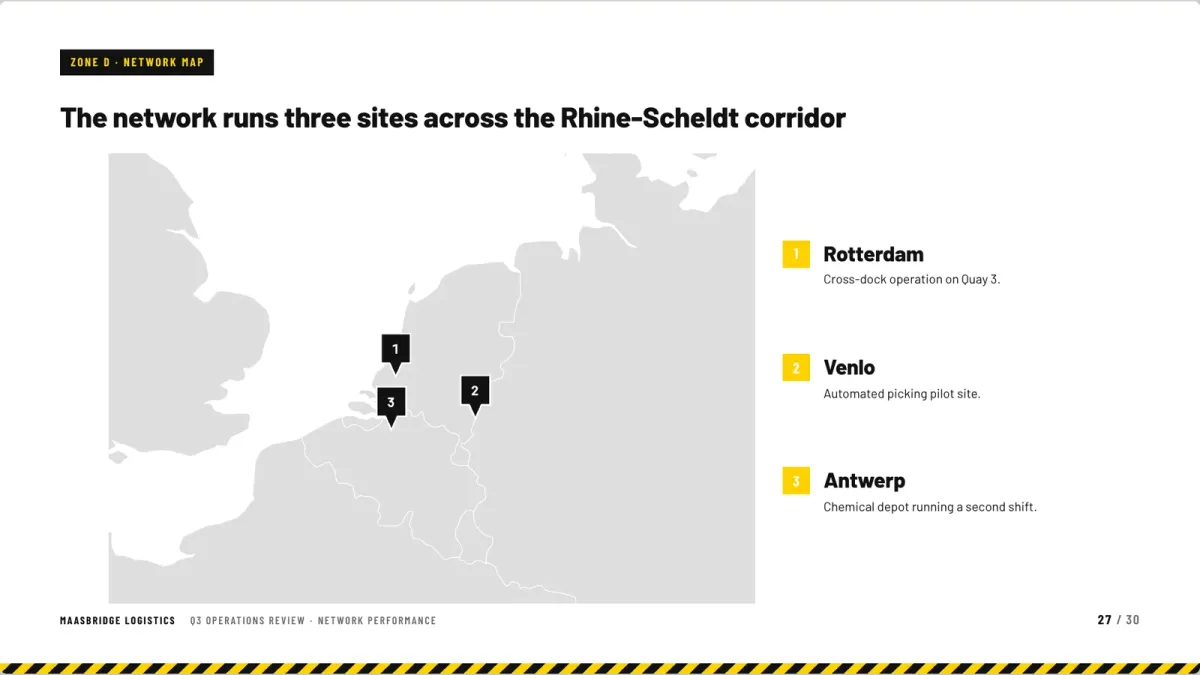
Name the places and the map finds them: pins with a numbered list, or countries shaded by a figure with its legend.
- Every country and region
- Cities of 15,000 people or more
- Each country a PowerPoint shape on paid plans
Structure
Diagrams for how things fit together
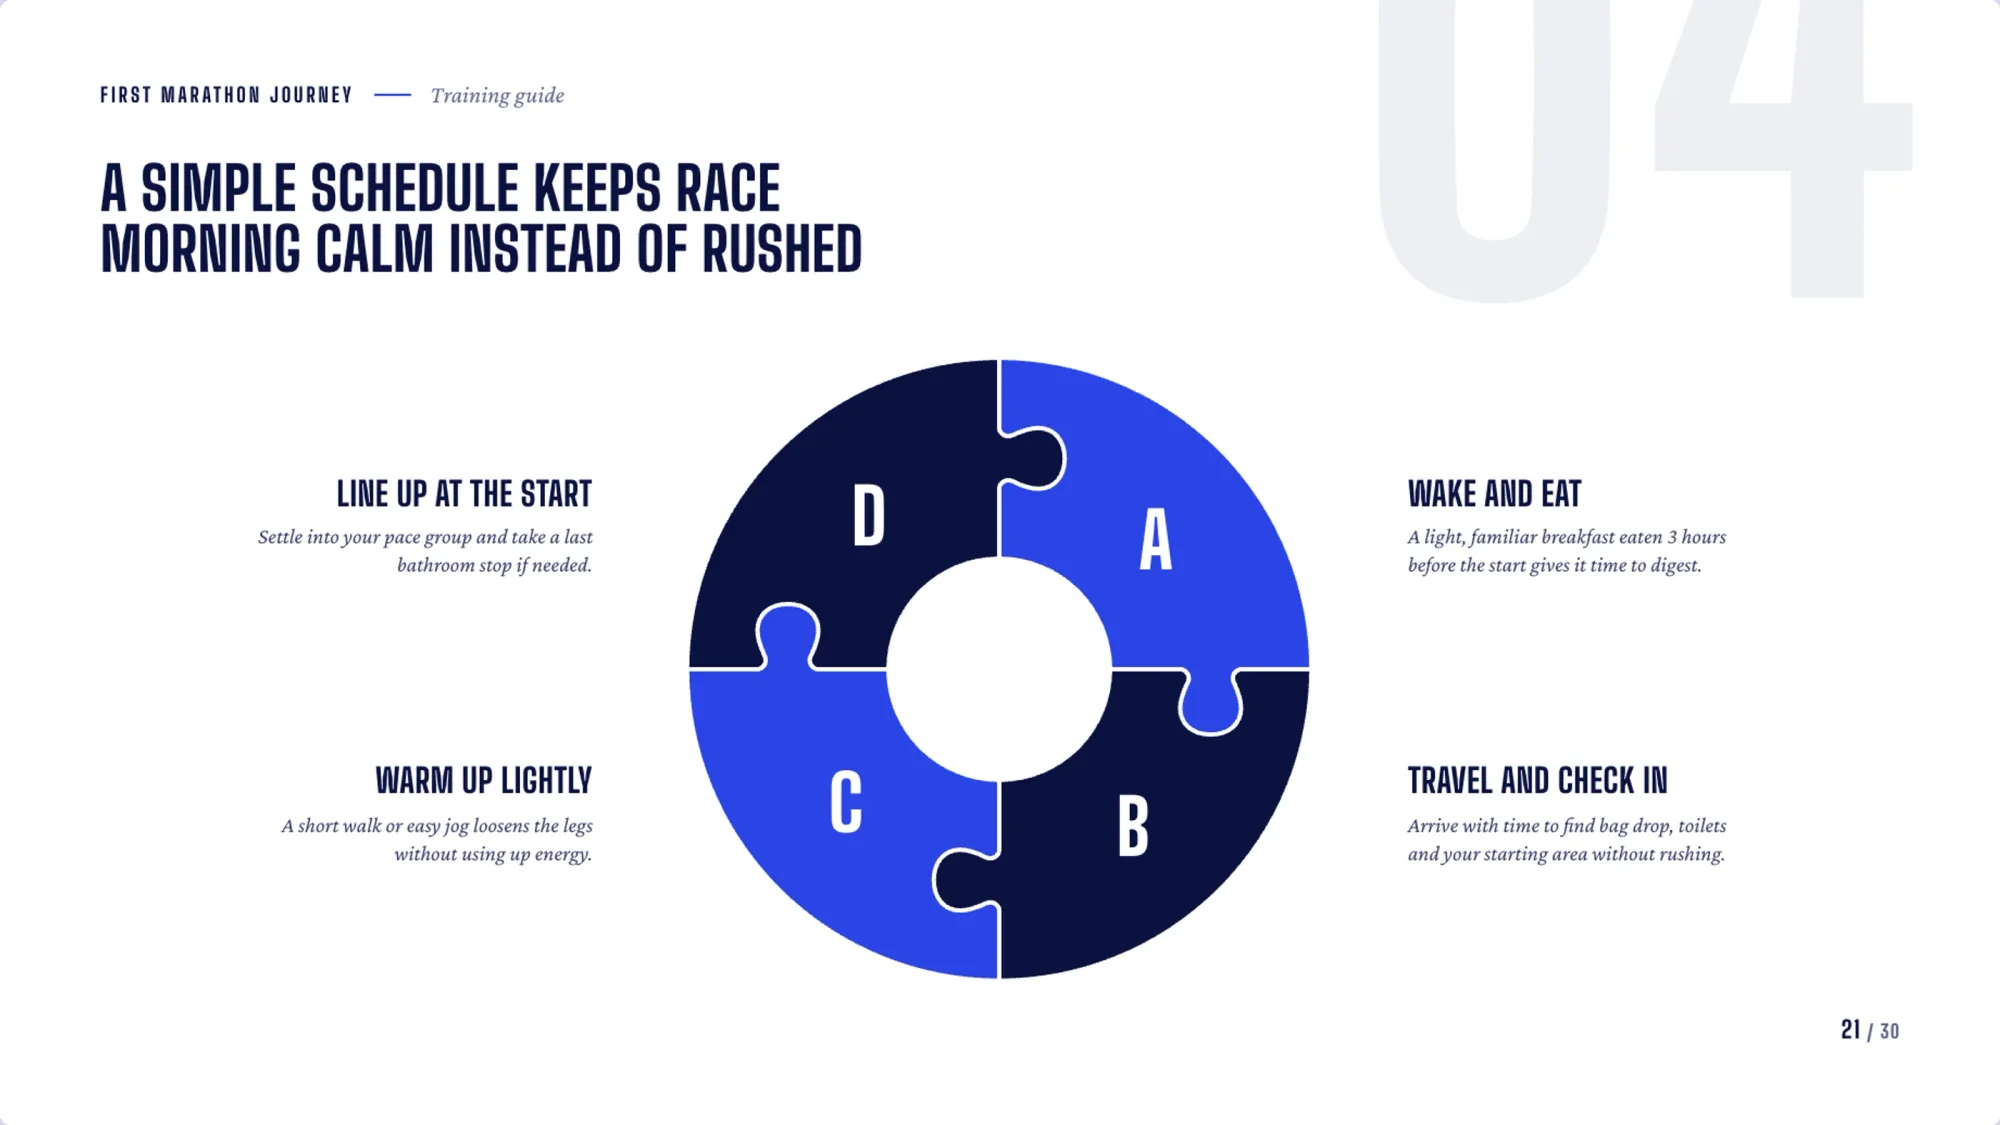
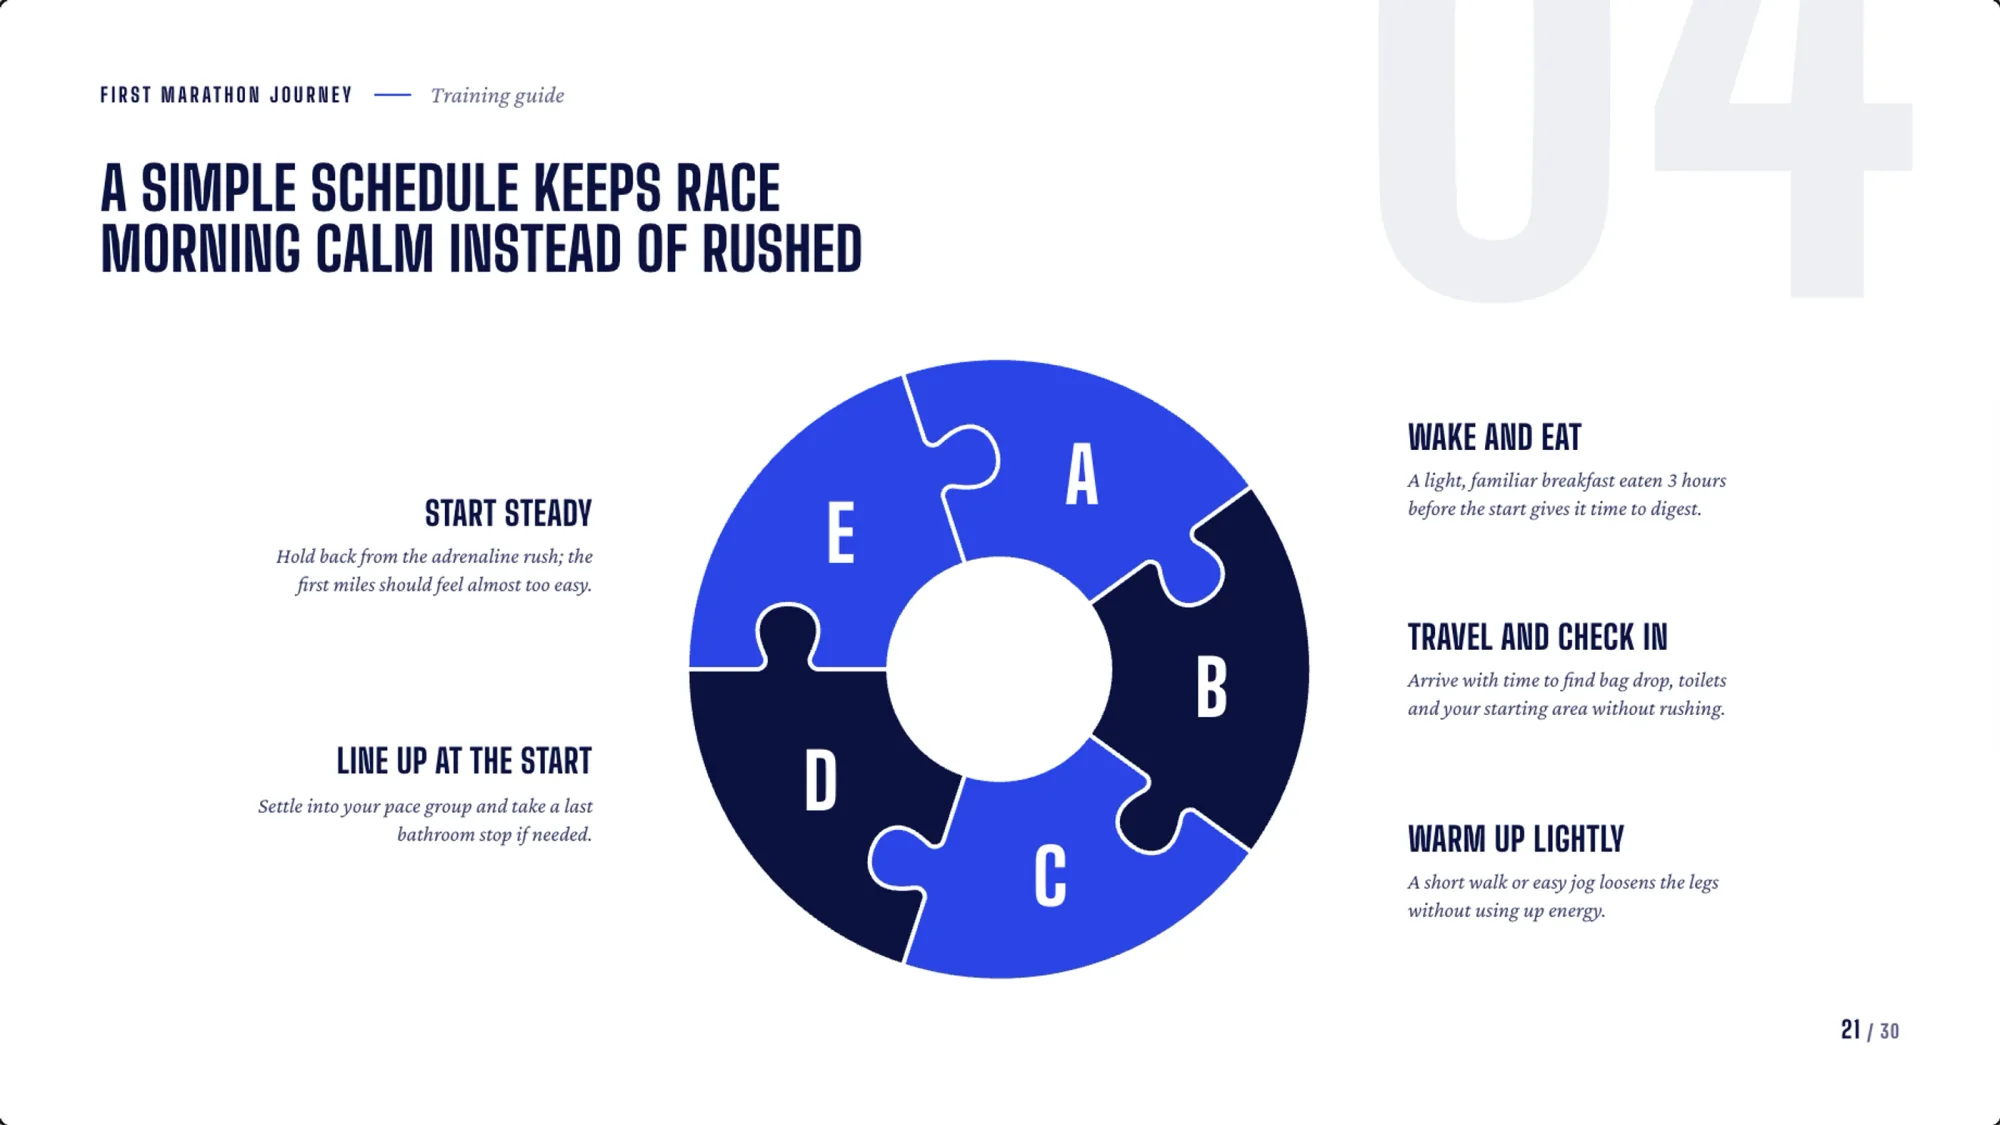
Venn diagrams, pyramids, funnels, cycles, puzzle rings and more, each drawn again when you add or remove a part.
- Add a part, it redraws
- Words rewritten to fit
- In every look
How it works
Three steps
- Step 1
Write the steps
Paste your list, or describe the process.
- Step 2
Pick the drawing
Choose a layout from the picker, or ask for one by name.
- Step 3
Change it by asking
“Add a legal review after step 2.” It redraws.
Questions
Questions, answered
Can I edit an infographic after it is made?
Yes. Click any words and type. Add or remove a step and the drawing redraws for the new count.
Do they stay editable in PowerPoint?
Yes. Shapes and text stay editable, and a smart flowchart’s boxes keep their connectors when you move them. Downloads are on the paid plans.
Which maps can it draw?
A map with pins for three to eight places, and a shaded map for two to twelve countries or regions. It knows every country, every region and every city of 15,000 people or more.
Will my words fit?
When you change a slide’s layout, its words are rewritten for the new design, and every box it draws is written.
Give your audience a slide they understand
Name places and get a map. Add a step and the diagram redraws, words rewritten to fit.