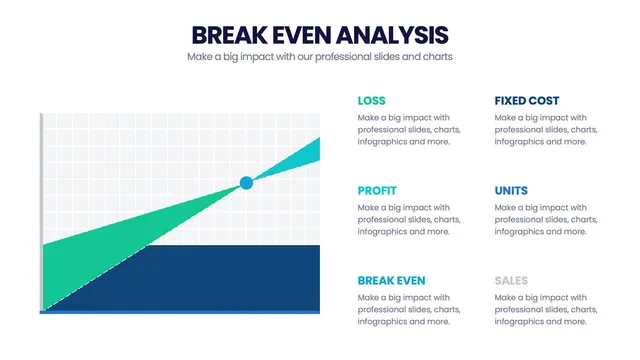
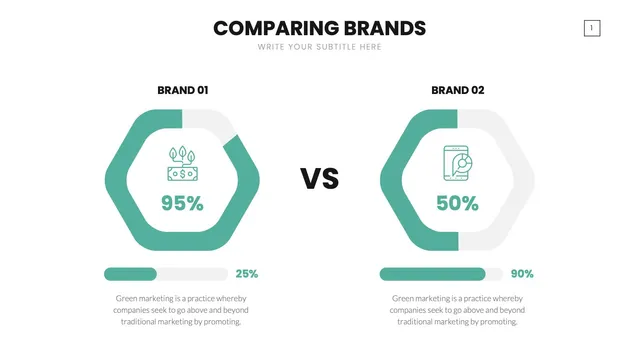
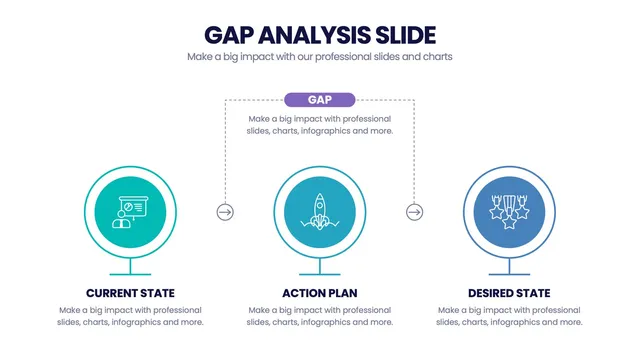
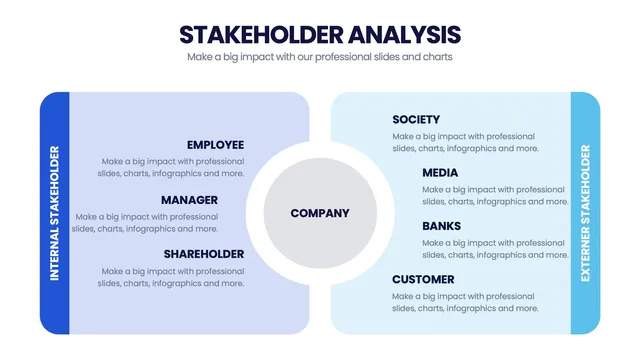
Use the classic break-even chart for product-launch storytelling, the contribution-margin layout for pricing decisions, the cost-volume-profit diagram for what-if analysis, and the multi-product break-even comparison for portfolio briefings.
Each design respects financial-analysis conventions while keeping the visuals approachable for non-finance audiences.
Open the file and update revenue, costs, and brand colors in minutes. A solid fit for startup pitch decks, product economics reviews, MBA case studies, finance training, and any moment when break-even storytelling needs visual clarity.