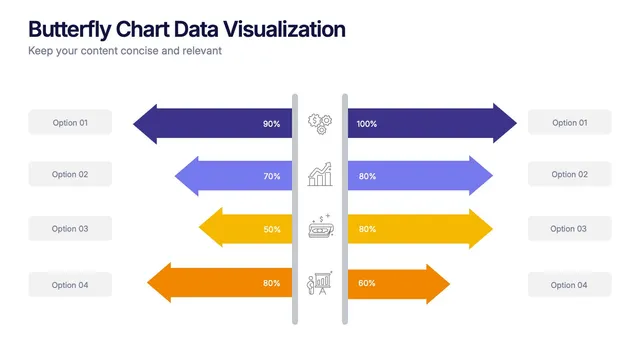
That is the whole idea behind the Butterfly Chart Data Visualization Presentation, a set of slides that places opposing values back to back so your audience can compare them at a glance.
Contrast survey answers, budget lines, before and after results, or performance across two groups. The mirrored shape gives your audience an instant sense of scale on both sides.