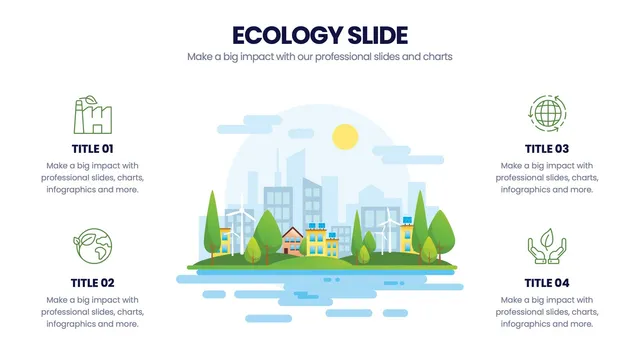
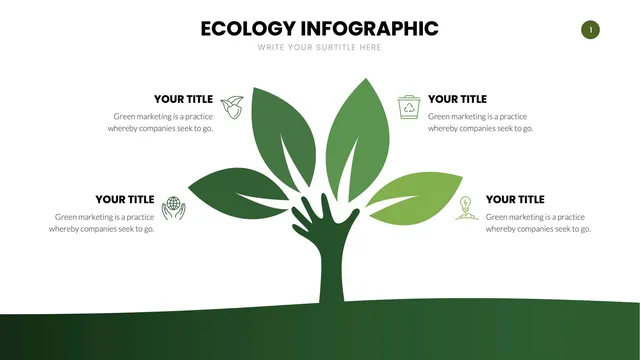
Use the carbon footprint layout for emissions storytelling, the recycling cycle for circular economy work, the biodiversity map for species and habitat reporting, and the renewable energy mix for power-source breakdowns.
Each design uses warm, organic visual language so the message lands without feeling preachy.
Open the file and update stats, categories, and brand colors in minutes. A solid fit for ESG reports, sustainability roadmaps, classroom environmental lessons, NGO advocacy decks, and any topic where the audience needs to see the planet's story told well.