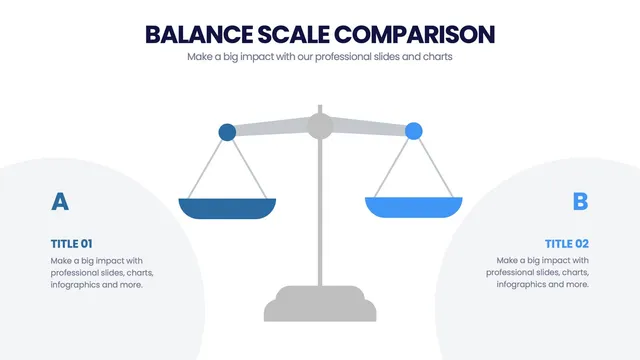
Use the balanced-scale visual for trade-off conversations, the proportional sphere or icon array for showing magnitude, the scale-of-impact gradient for comparing initiatives, and the small-to-enterprise tier for company-stage stories.
Every design favors visual proportion over text descriptions.
Open it and update labels, sizes, and colors in minutes. Useful for company size comparisons, scientific scale visuals, decision trade-off frameworks, market sizing decks, and any moment when the audience needs to feel the gap between things, not just read about it.