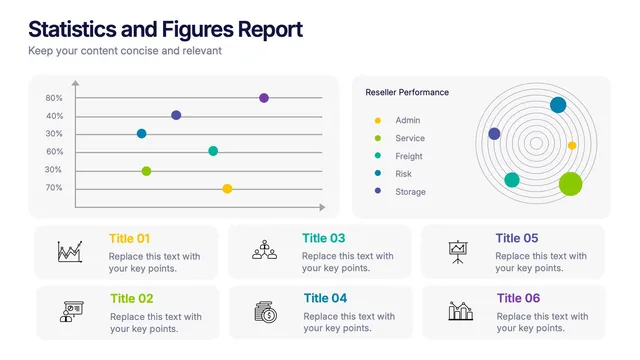
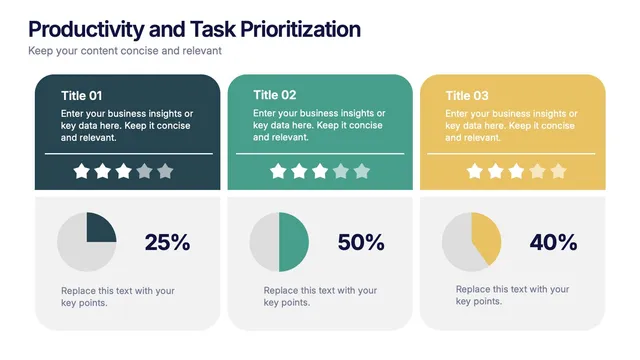
Change that with the Statistics and Figures Report Presentation, which gives your data a structure listeners can actually follow.
Bring it to quarterly reviews, research readouts, or public reports. Your audience gets the findings without wading through an appendix.
As a presentation template it stays flexible. Edit the text, restyle the visuals, and drop in fresh figures whenever the data changes. That keeps every report consistent from month to month.