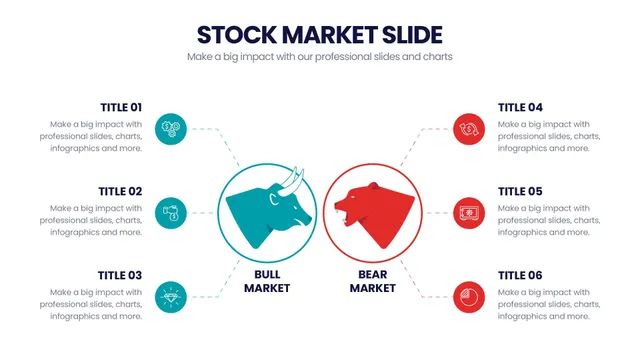
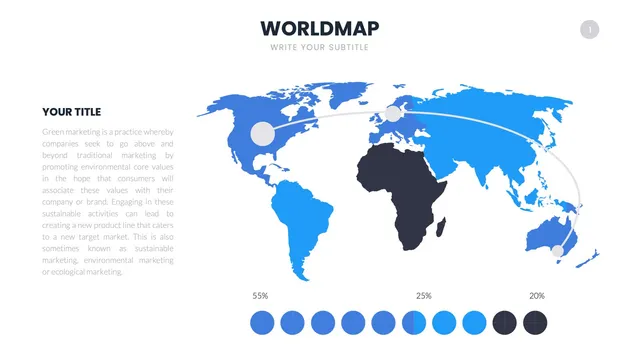
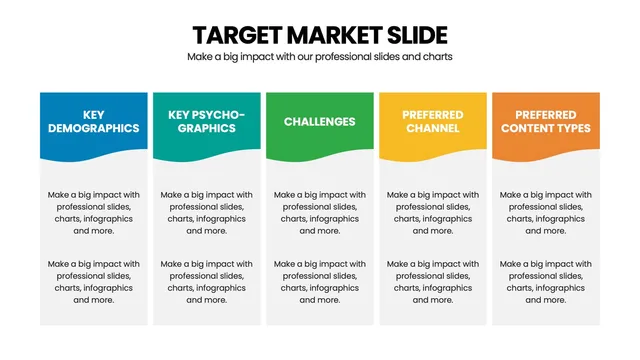
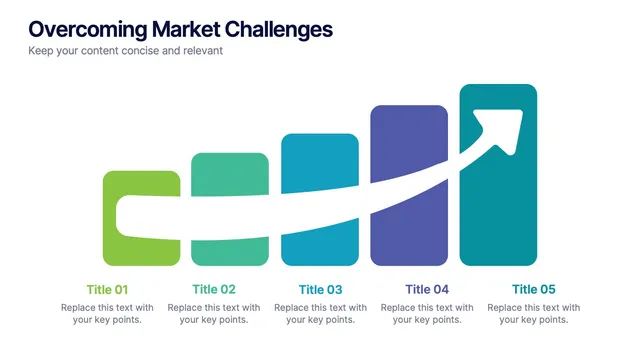
Use the portfolio allocation layout for asset-mix storytelling, the index comparison chart for benchmark reporting, the sector rotation diagram for market-cycle communication, and the candlestick layout for technical analysis briefings.
Each design respects financial conventions while keeping the visuals readable for non-specialist audiences.
Open the file and update tickers, allocations, and brand colors in minutes. A solid fit for financial advisor pitches, equity research briefings, fintech education, IR roadshows, and any moment when market topics need a polished visual story.