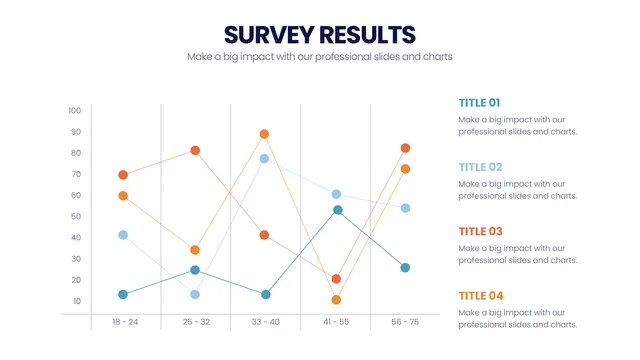
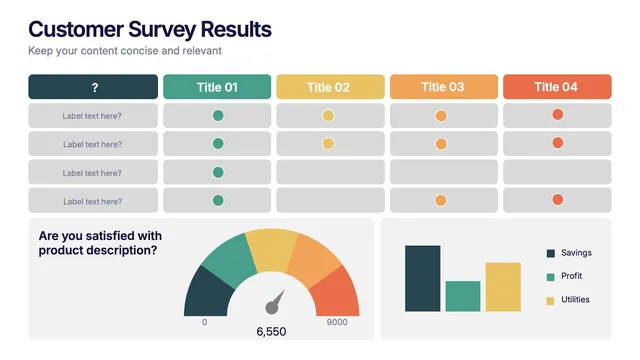
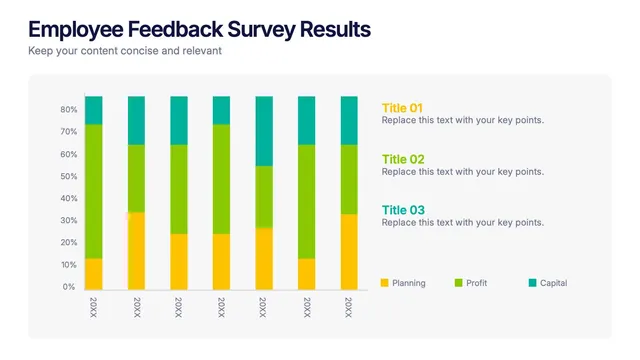
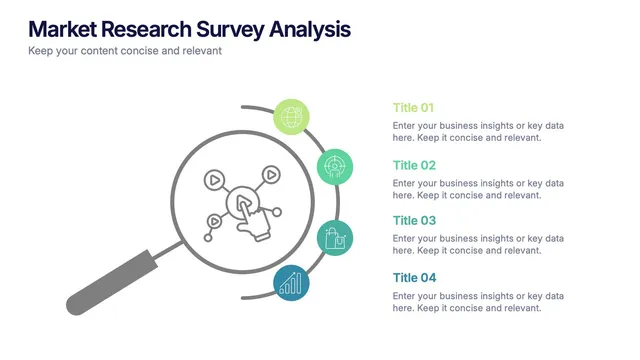
Use the response distribution layout for demographic breakdowns, the NPS scorecard for customer loyalty reporting, the sentiment analysis layout for open-text themes, and the comparison grid for year-over-year survey trending.
Each design respects data conventions while keeping the visuals scannable for executive audiences.
A solid fit for employee engagement reports, customer experience reviews, product research decks, market research presentations, and any moment when the survey needs to tell a clear story.