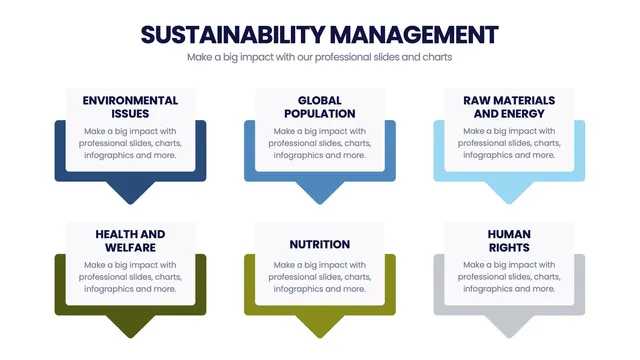
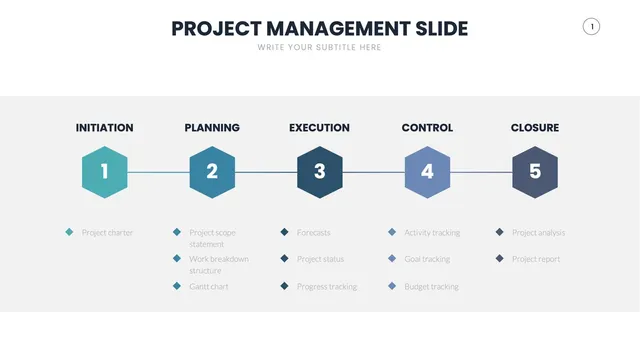
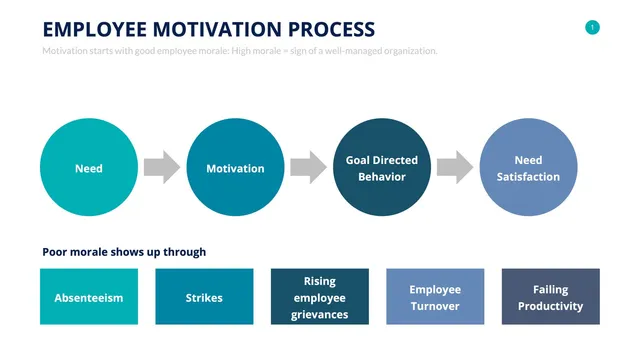
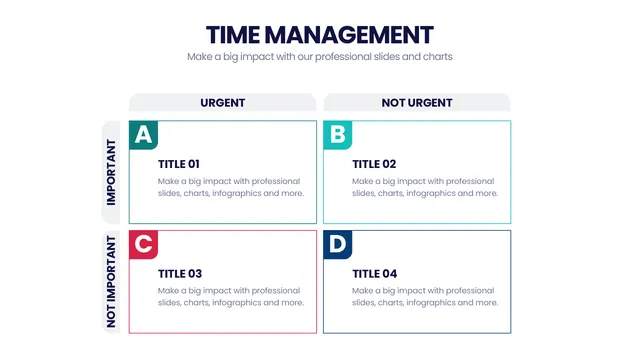
Use the SDG alignment grid for stakeholder reporting, the carbon footprint breakdown for emissions storytelling, the materiality matrix for ESG prioritization, and the circular-economy diagram for product-stewardship briefings.
Each design respects sustainability-management conventions while keeping the visuals approachable for board and external audiences.
Open the file and update metrics, goals, and brand colors in minutes. A solid fit for ESG annual reports, sustainability strategy decks, investor briefings, B Corp documentation, and any moment when sustainability management needs both rigor and visual polish.