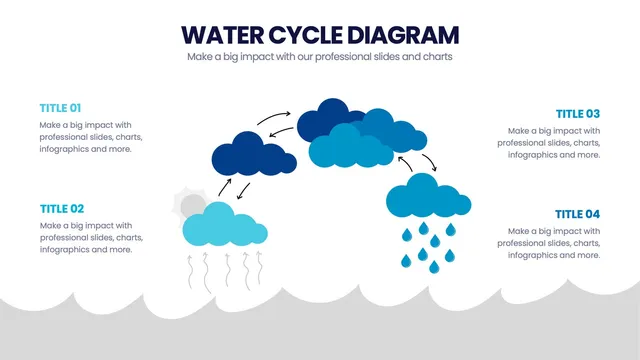
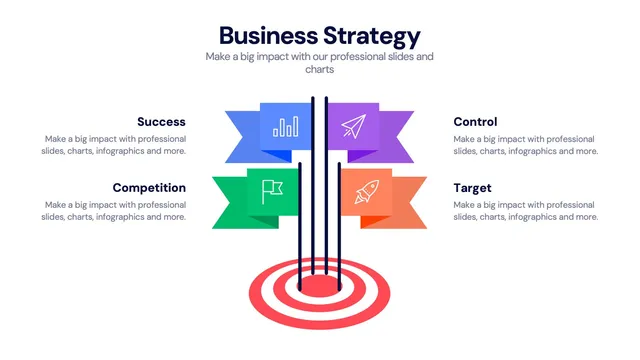
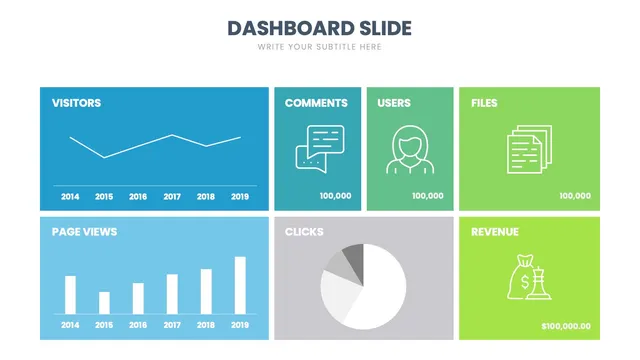
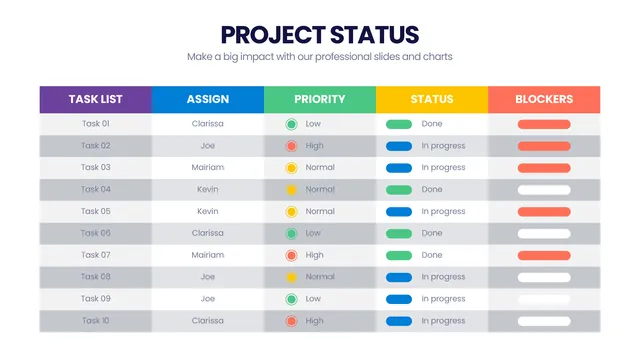
Use the consumption breakdown for behavior-change campaigns, the water-cycle diagram for science education, the treatment-plant flow for utilities and infrastructure, and the scarcity map for advocacy and policy work.
Each design respects both the science and the stakes.
Open the file and update icons, percentages, and colors in minutes. Built for environmental reports, science classrooms, utility briefings, NGO advocacy, and any conversation where the topic of water needs to land with the weight of a glass running empty.