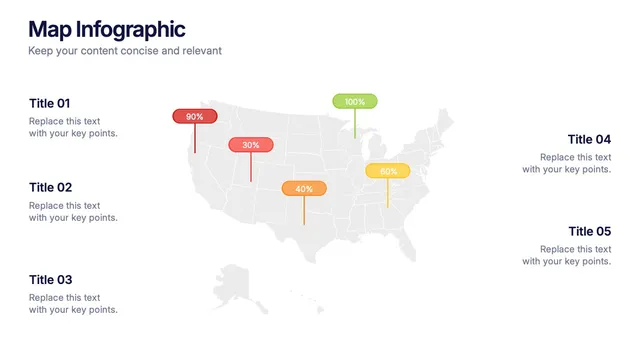
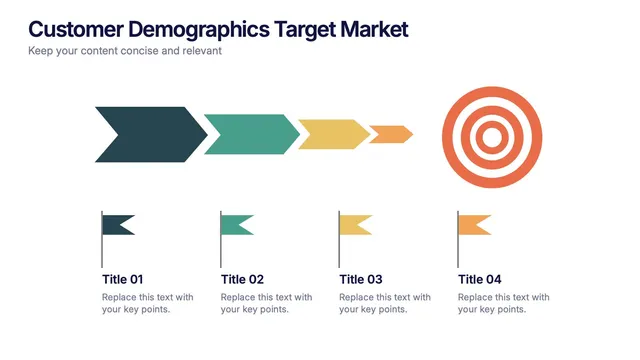
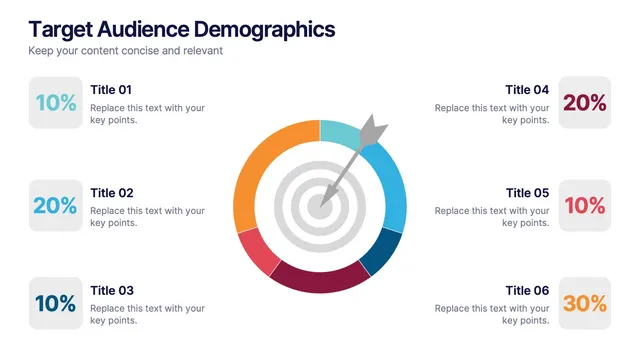
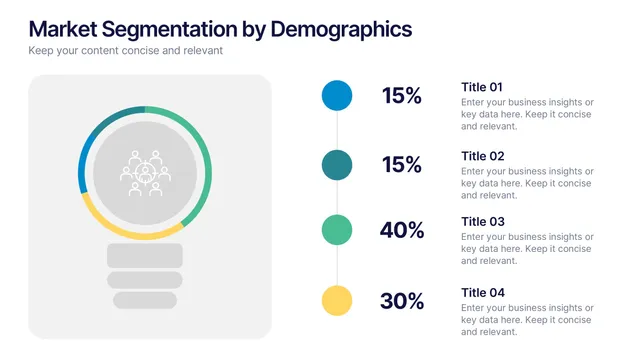
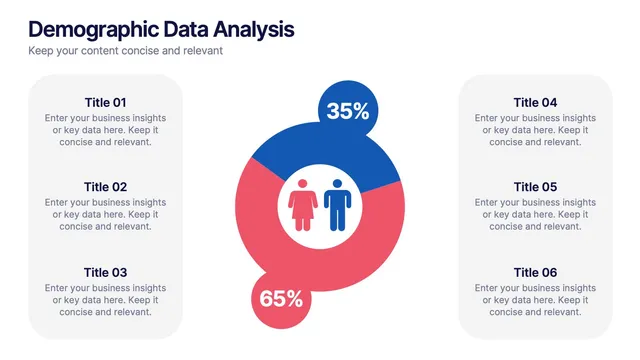
The Customer Demographics Map Presentation lets you show where your customers actually are, so regions, segments, and age groups stop being abstract rows of data and start looking like a real market.
Use these slides in marketing plans, sales territory reviews, expansion proposals, and research readouts. Add your segments, mark the regions that matter most, and keep labels short so the map stays the focus of the slide. Your audience will point at the screen and ask better questions, which is exactly what a good data presentation should cause. That is how location data earns its place in the meeting.