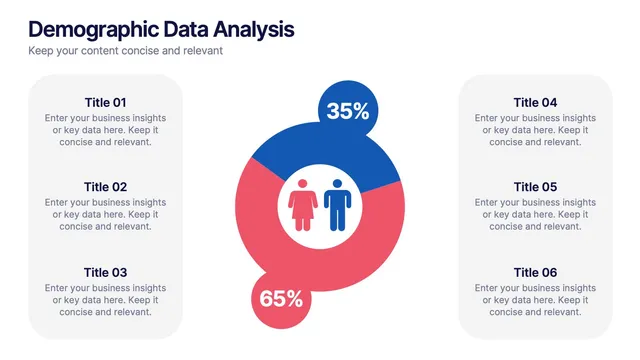
Researchers, marketers, and public sector teams all need to explain who a population is before explaining what it does.
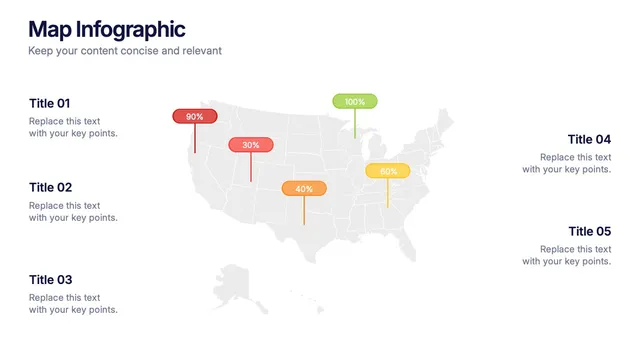
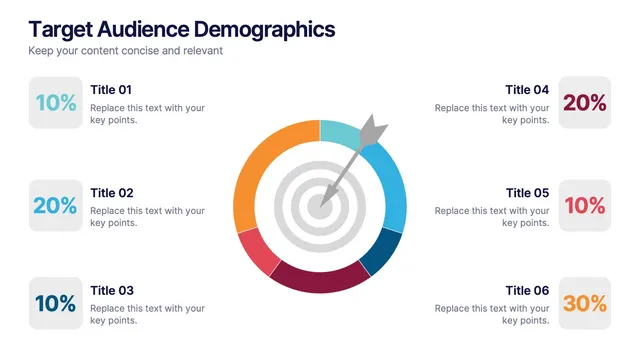
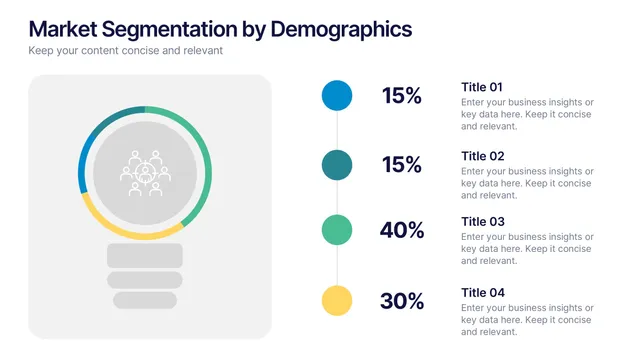
These slides give that explanation a home, whether you are profiling survey respondents or describing a city. A clear who makes every later chart easier to read.
Replace the sample content with your own analysis and restyle the visuals to suit your report. The next study can reuse the same file.