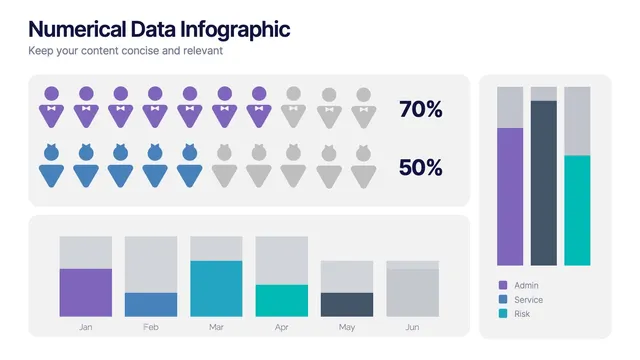
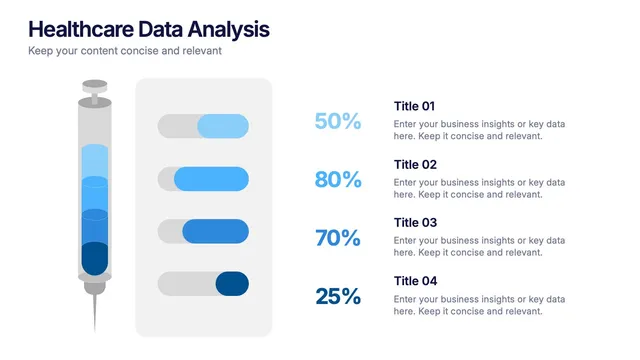
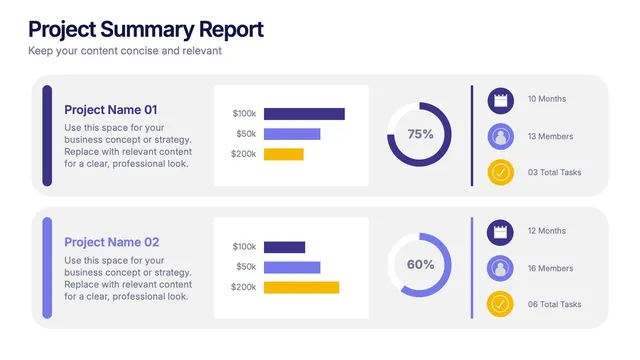
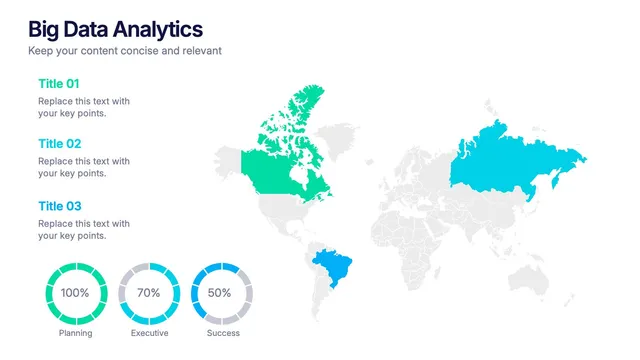
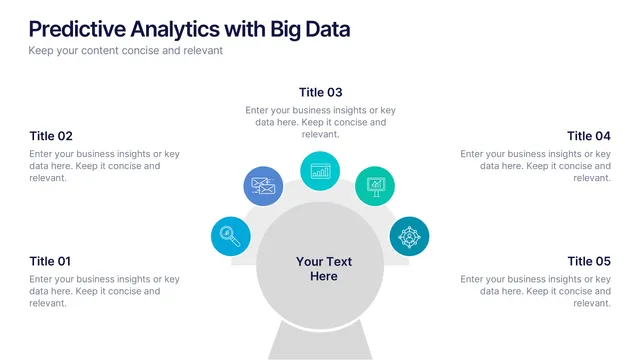
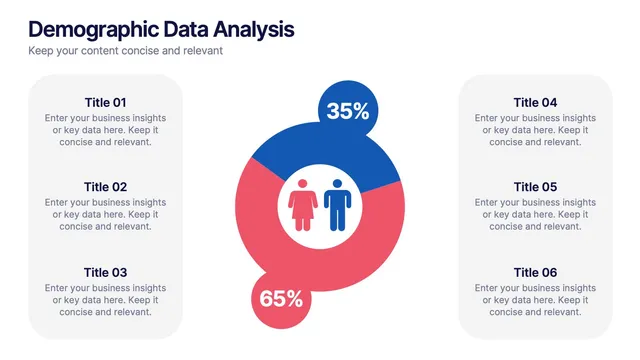
Report monthly results, summarize research findings, or compare performance across teams. When each number sits inside a visual, people stop squinting at rows and start following your point.
That is the difference between showing data and explaining it.
Type your figures into the slides, rename the labels, and recolor the layout to fit your report. The same file serves finance reviews, class projects, and client updates.