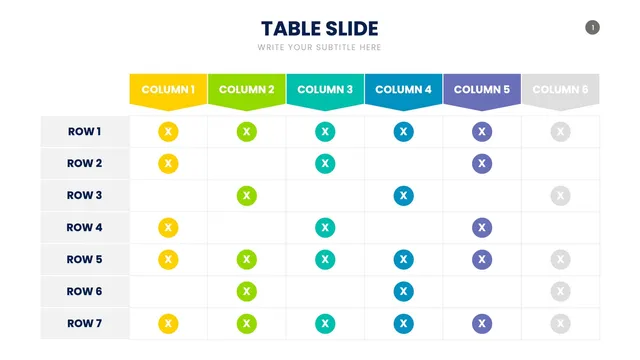
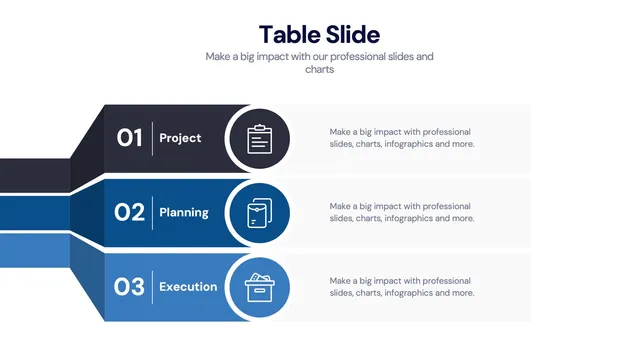
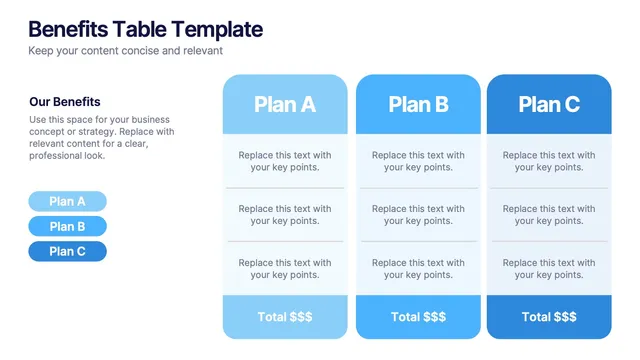
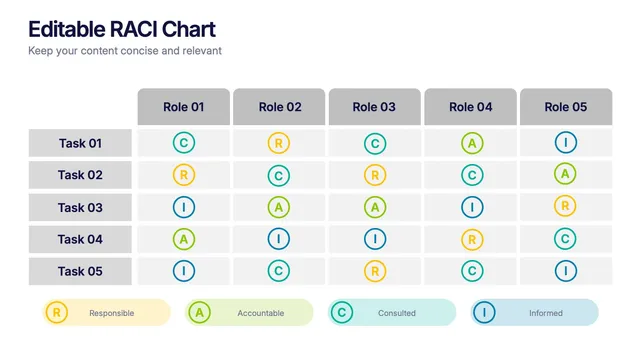
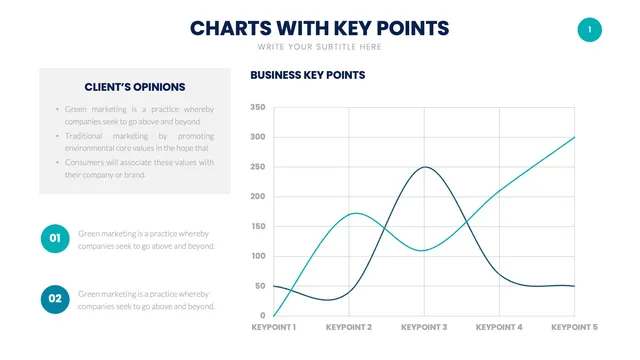
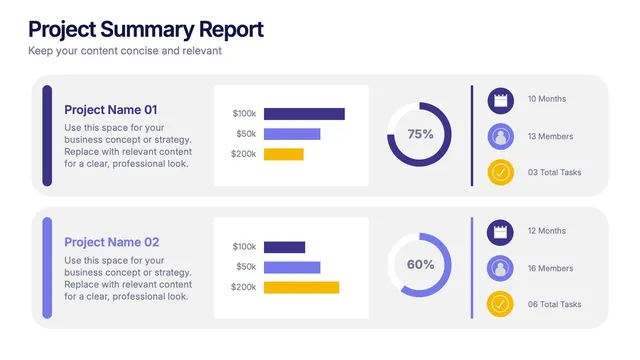
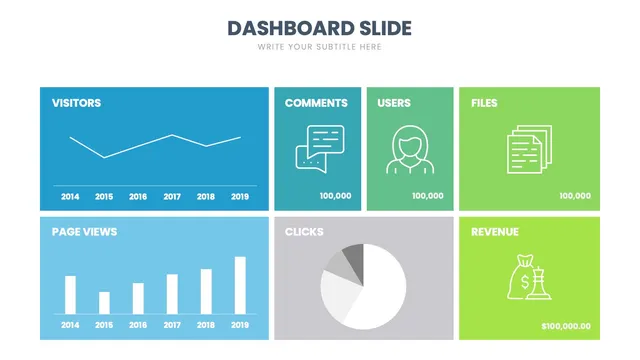
This pack of table infographic layouts gives presenters, finance teams, and operators polished visuals for feature comparisons, pricing tables, schedules, and rosters that earn attention in a deck full of charts.
Use the comparison table for two-to-five column compares, the schedule table for time-based content, the pricing table for SaaS-style plans, and the data table with row highlights when one cell deserves the spotlight. Each design balances information density with the visual clarity a printed leave-behind deserves.
Open it and update rows, columns, and colors in minutes. A solid fit for product feature comparisons, pricing pages, training schedules, project status grids, and any moment when a table needs to feel as designed as the rest of the deck.