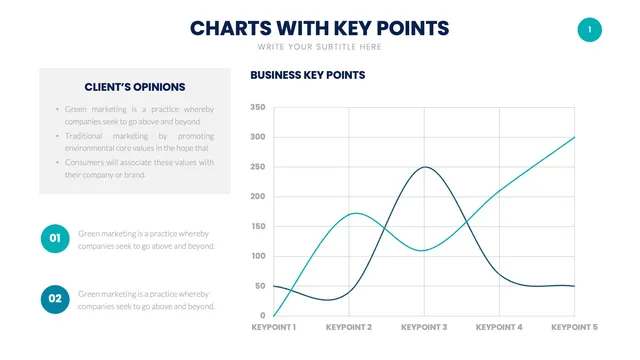
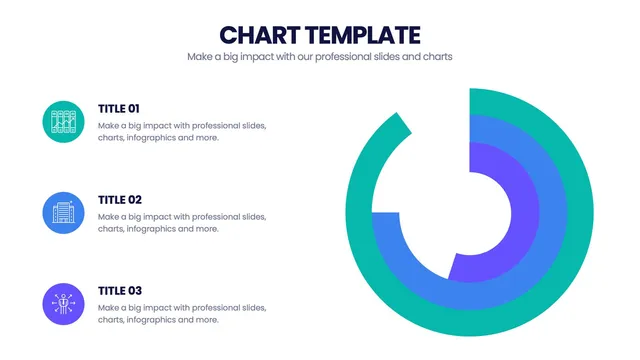
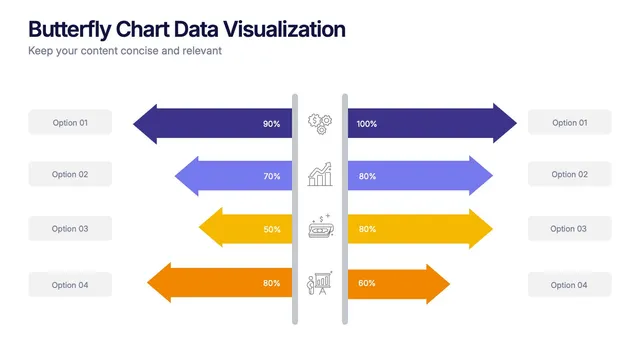
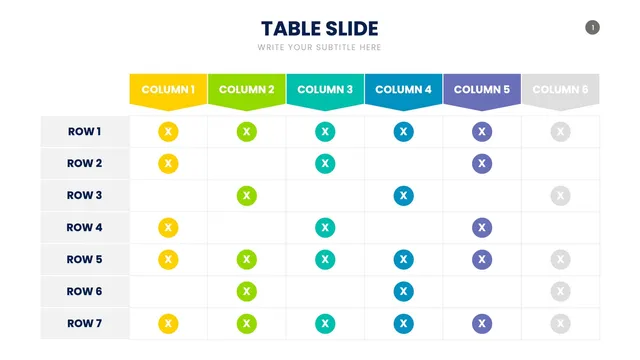
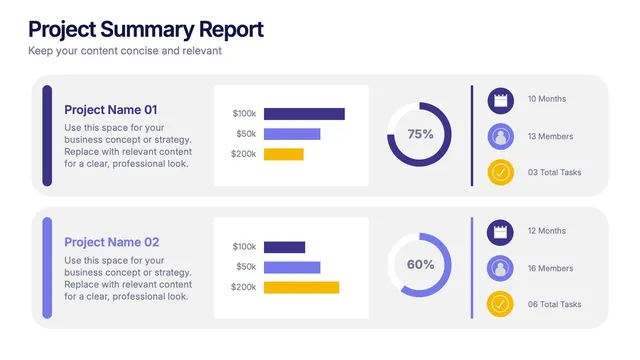
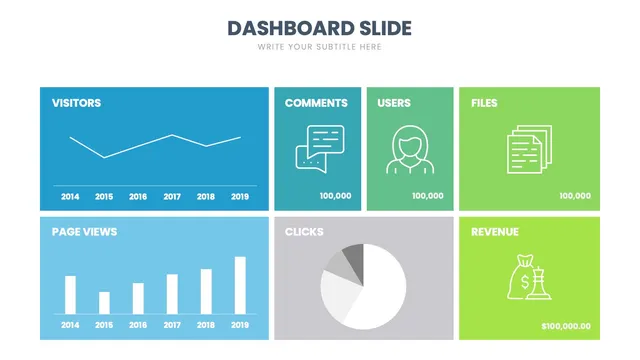
Use the column and bar charts for comparisons, the line and area charts for trends over time, the pie and donut for share of total, and the combo charts when one axis is not enough.
Each design is built for clarity first: clean labels, sensible color, and proportions you can trust at a glance.
Open the file and update values, colors, and axis labels in minutes. Useful for analytics reviews, quarterly reports, sales pipeline decks, marketing performance updates, and any presentation where a great chart does the heavy lifting.