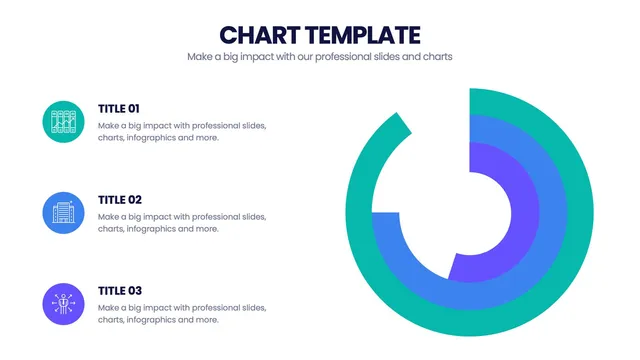
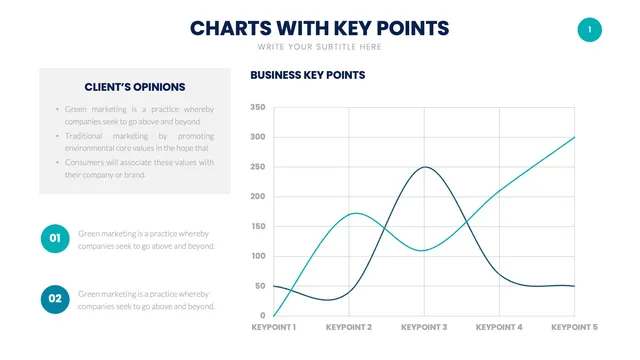
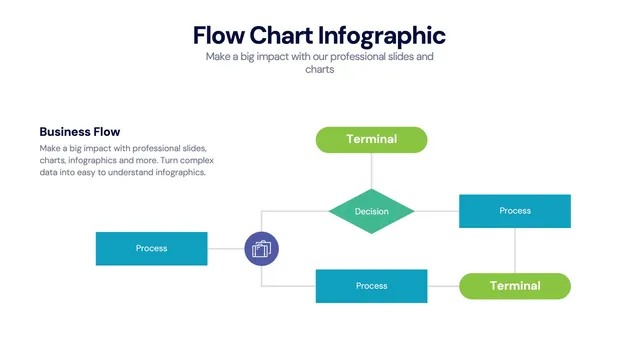
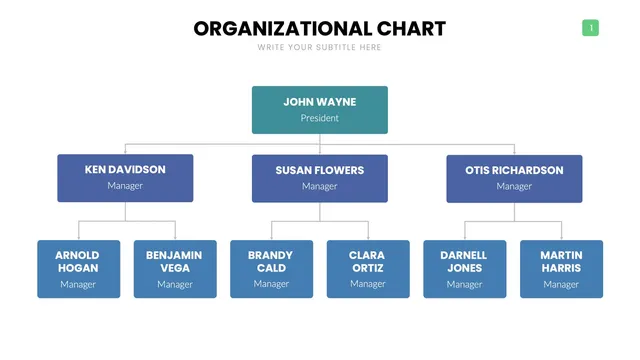
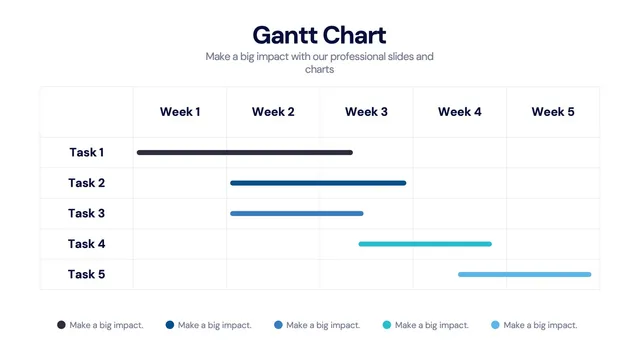
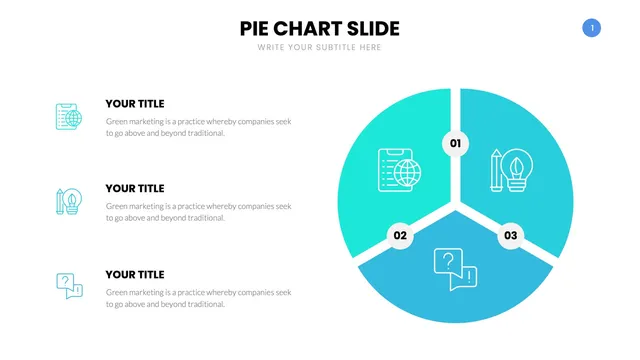
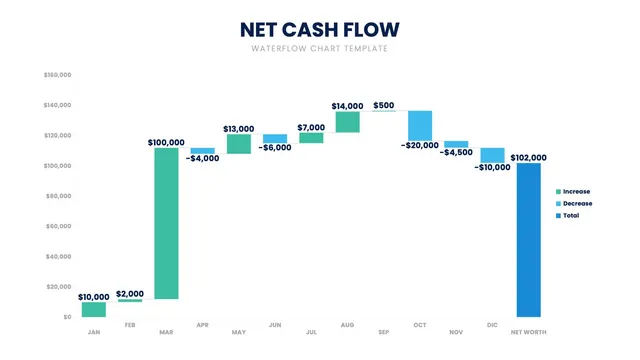
Use the comparison bar charts for side-by-side analysis, the time-series line charts for trends, the donut and pie variants for proportional storytelling, the combo and stacked layouts when one chart needs to carry two stories, and the specialty layouts like Mekko, waterfall, and Pareto when the data calls for something more nuanced.
Each design balances visual cleanness with the analytical accuracy a serious data conversation expects.
Open the file and update values, axes, and brand colors in minutes. A solid fit for quarterly business reviews, board decks, finance reports, product analytics readouts, and any deck where the data does the heavy lifting.