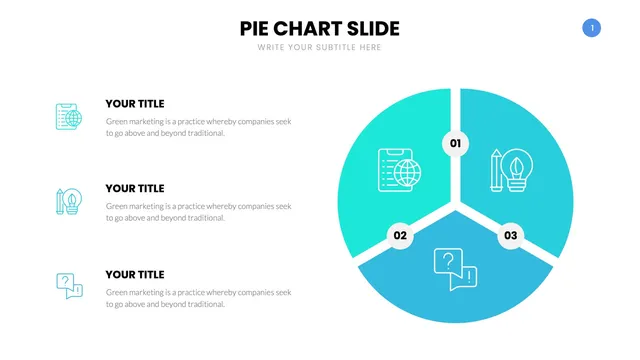
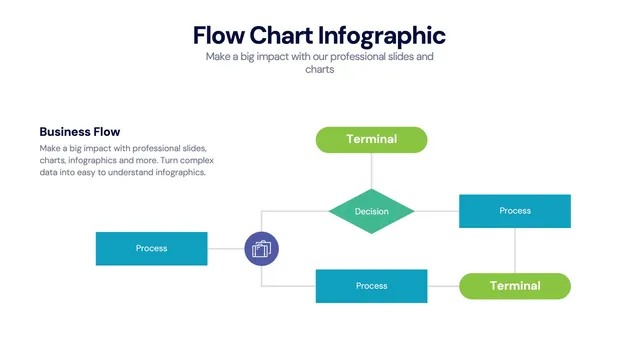
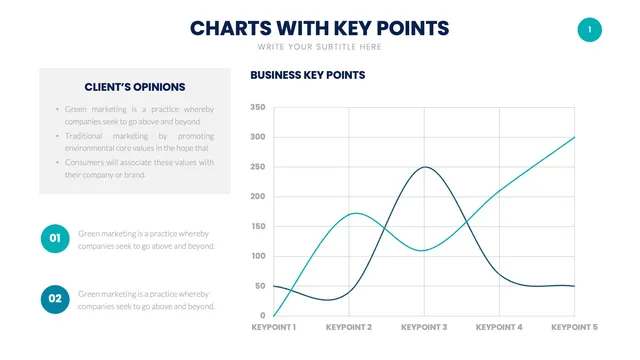
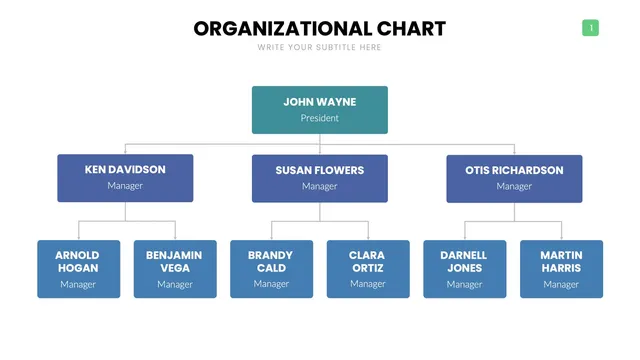
This pack of pie chart infographic layouts gives analysts, marketers, and finance teams a polished visual library for category splits, market share, budget allocation, and survey results.
Use the simple pie for two-to-five category splits, the donut chart when the center deserves a headline number, the exploded pie when one slice needs emphasis, and the stacked pie comparison for period-over-period analysis. Each design keeps slice angles accurate and labels readable from across the room.
Open it and update percentages, labels, and colors in minutes. Useful for market share decks, marketing channel reports, budget breakdowns, survey result presentations, and any conversation where the audience needs to see the parts that add up to the whole.