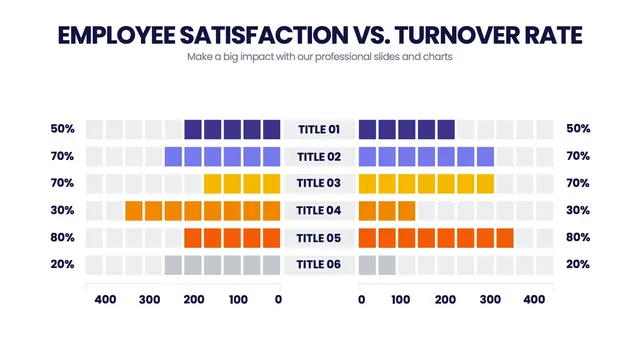
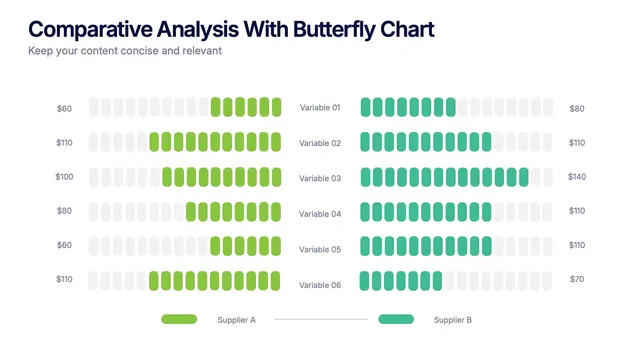
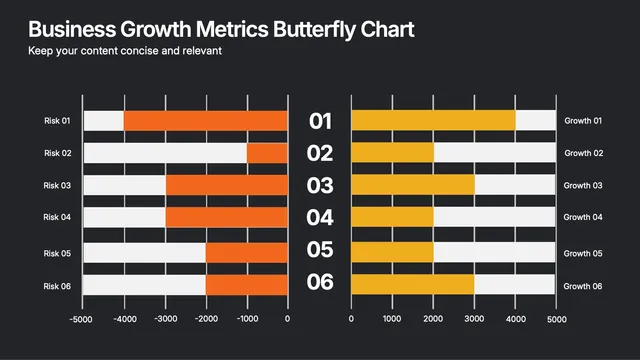
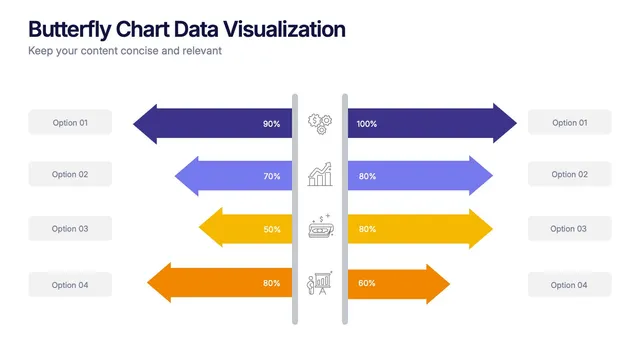
Some use horizontal bars for population pyramids and survey splits. Others stack ranges for revenue vs cost or import vs export.
A few add color shading to highlight the gap rather than the values themselves.
Open it and update labels, scales, and palettes in minutes. Useful for HR demographics, customer survey results, financial dashboards, and any analysis where the story is in the difference between two sides.