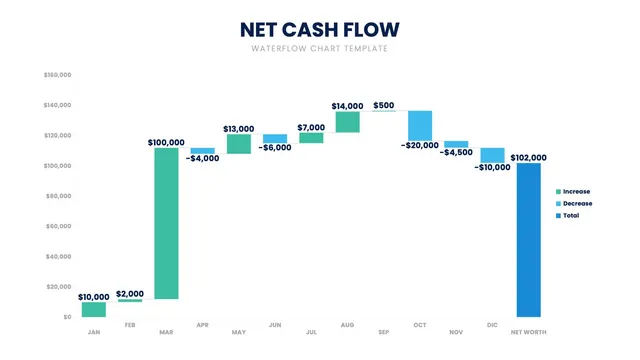
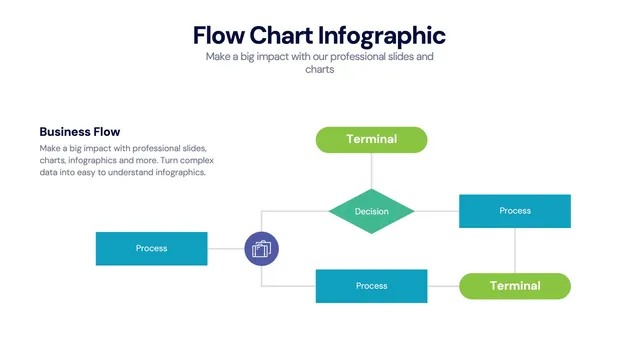
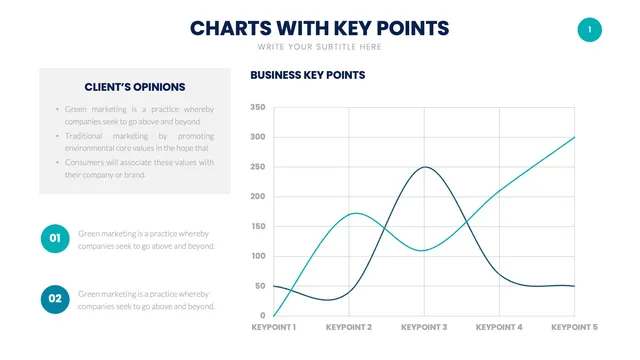
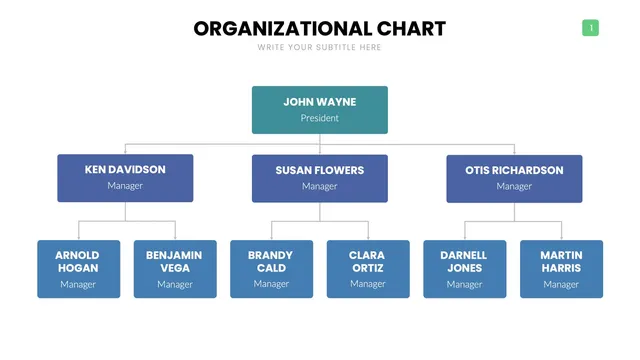
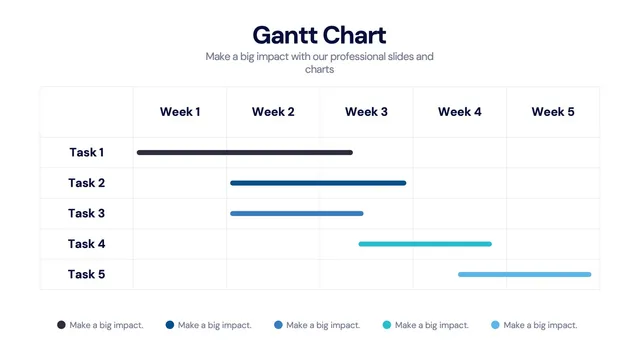
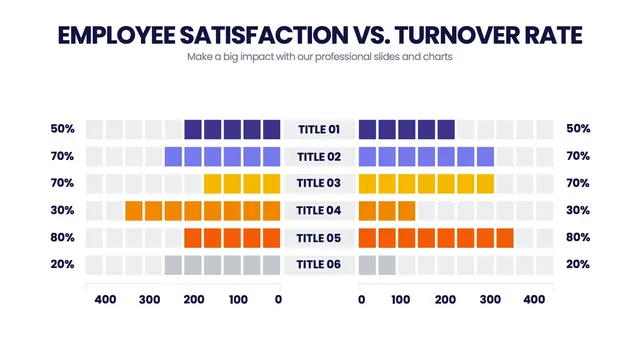
This pack of waterfall chart infographic layouts gives finance teams, analysts, and operators polished visuals for revenue bridges, cost analyses, headcount changes, and any cumulative story that needs more than a single bar.
Use the revenue waterfall for budget-to-actual bridges, the cost waterfall for COGS analyses, the headcount waterfall for workforce planning conversations, and the EBITDA waterfall for the kind of board chart that explains a year in one picture. Each design keeps proportions accurate so the math behind the visual stays honest.
Open it and update values, labels, and colors in minutes. A solid fit for budget reviews, board financial updates, variance analysis decks, M&A presentations, and any moment when the audience needs to see how the starting point became the result.