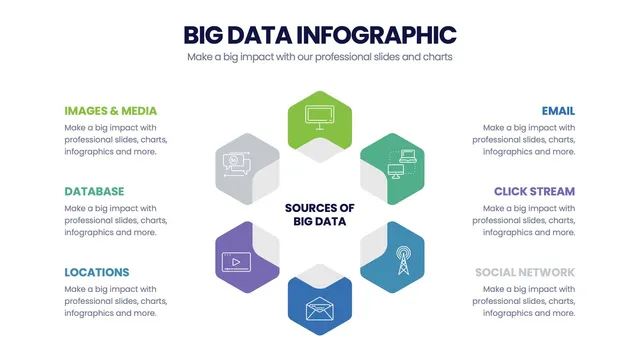
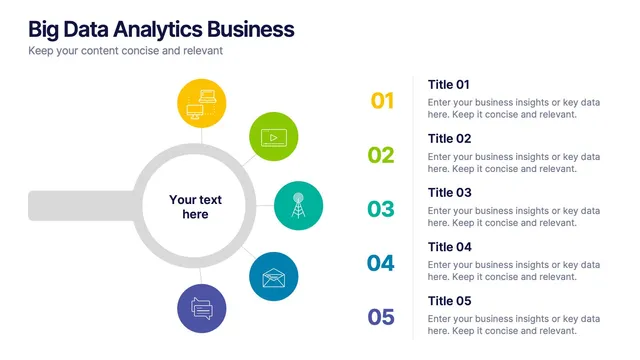
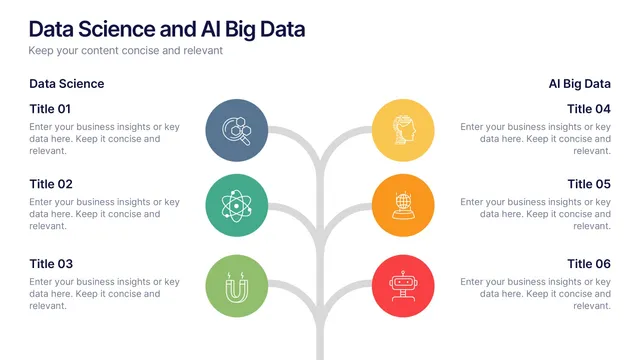
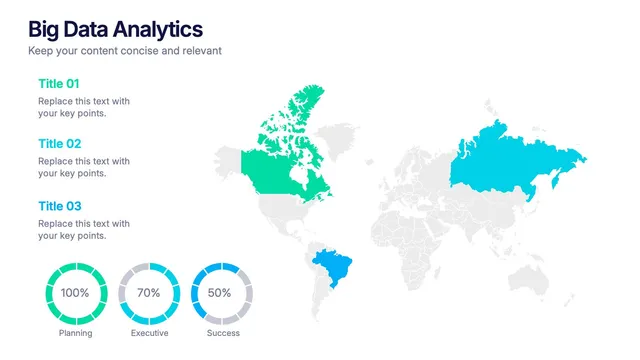
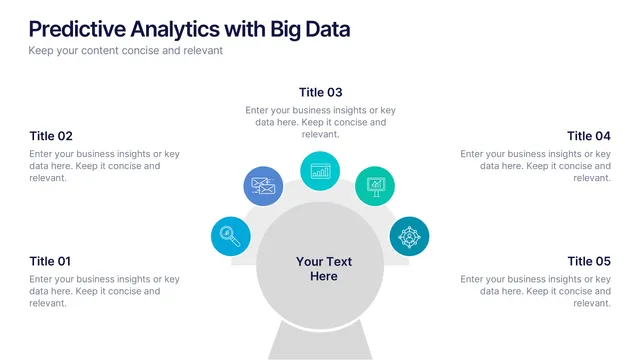
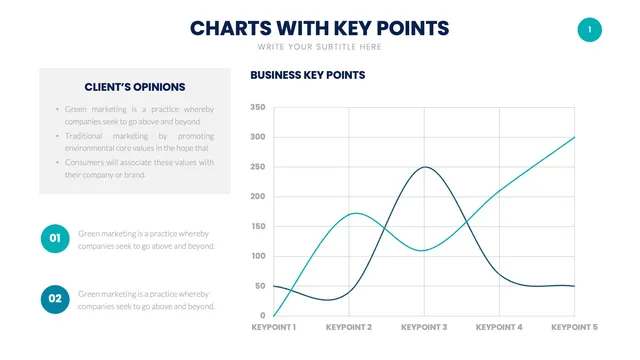
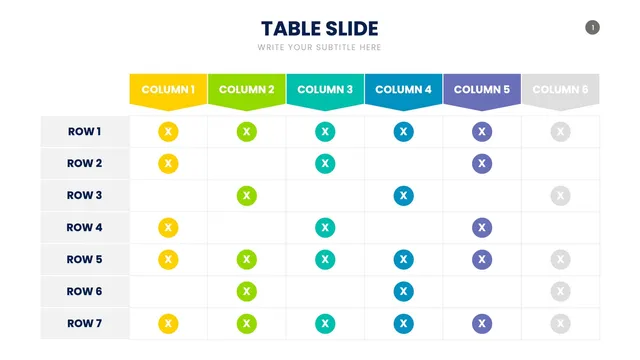
Use the four V's layout for big-data definition, the data-pipeline diagram for technical architecture storytelling, the analytics-maturity model for transformation planning, and the use-case grid for business-value framing.
Each design balances technical credibility with the visual clarity that executive audiences need.
Open the file and update sources, metrics, and brand colors in minutes. A solid fit for data strategy kickoffs, analytics roadmaps, digital-transformation decks, vendor pitches, and any moment when big data needs to be made approachable for non-technical stakeholders.