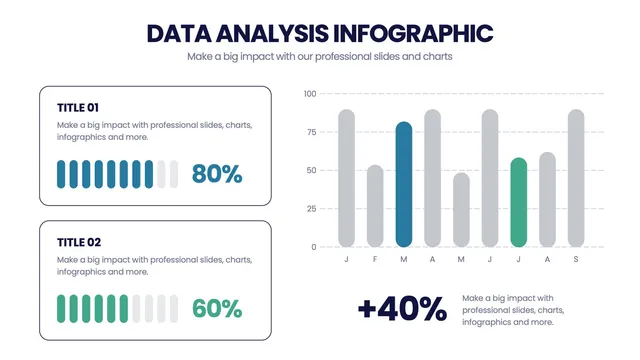
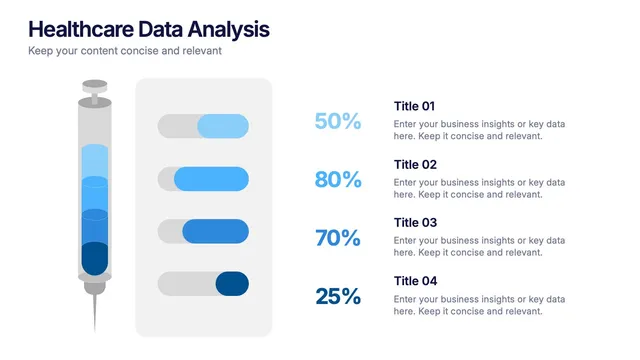
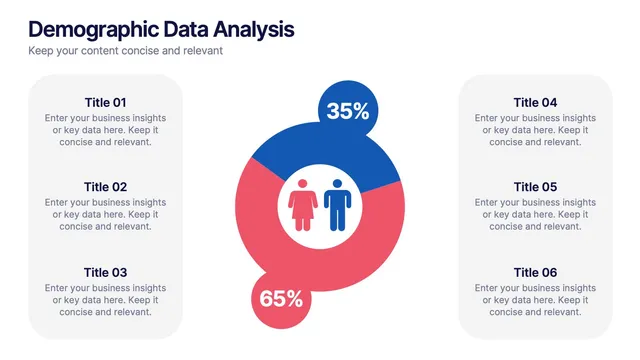
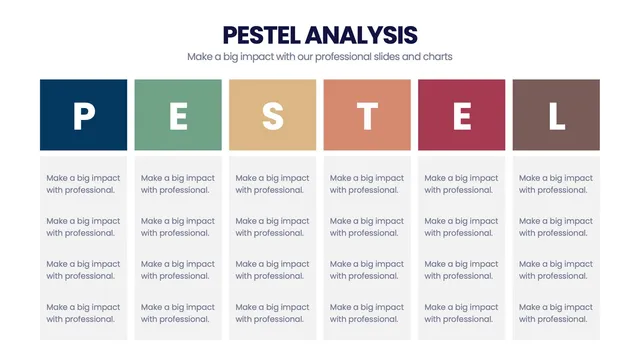
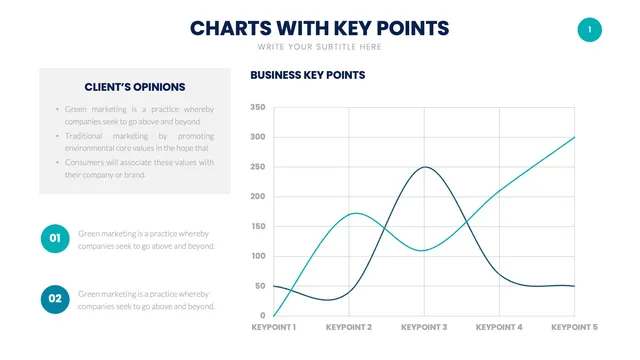
Use the multi-chart analytics layout for performance briefings, the statistical-significance grid for A/B test debriefs, the dashboard-style summary for BI reporting, and the trend-over-time layout for longitudinal storytelling.
Each design respects data-visualization conventions while keeping the visuals approachable for non-analyst executives.
Open the file and update charts, findings, and brand colors in minutes. A solid fit for analytics briefings, A/B test debriefs, BI reporting, executive data summaries, and any moment when data-driven insight needs polished visual storytelling.