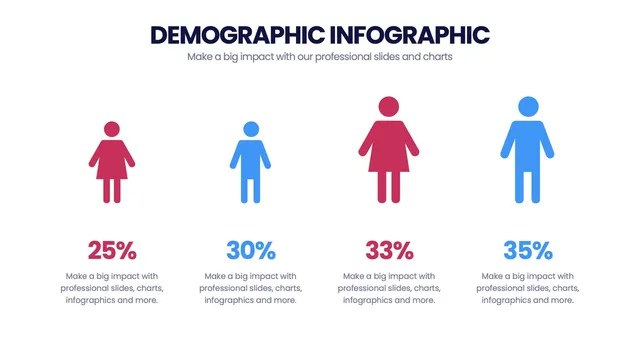
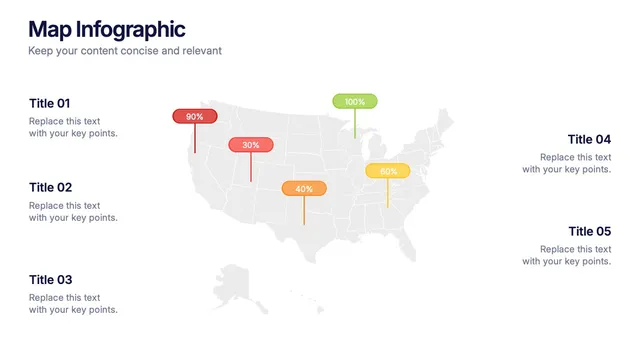
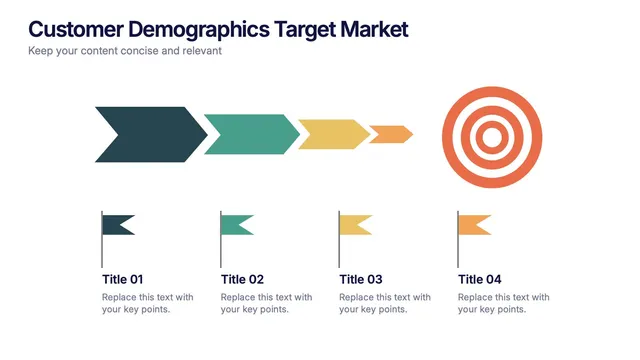
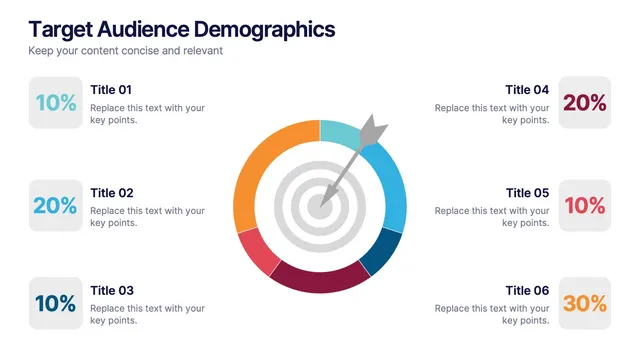
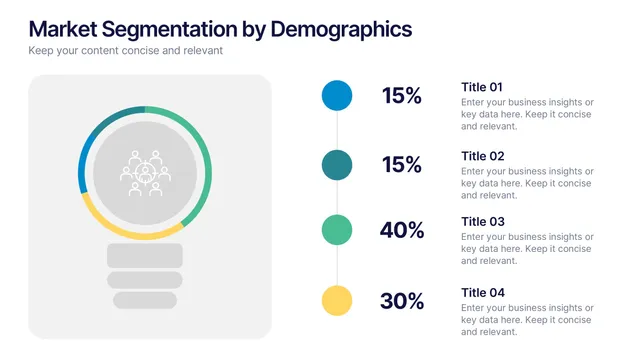
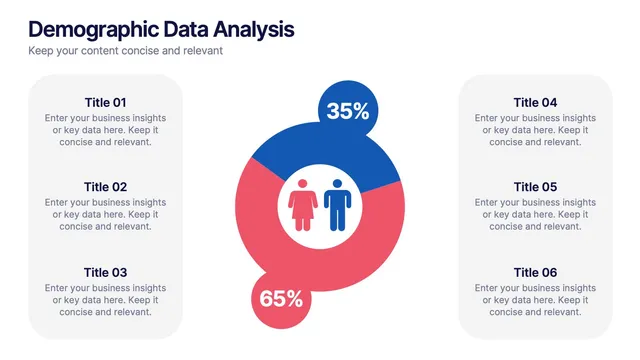
Use the age-pyramid layout for population structure, the gender-and-income split for audience composition, the generational-cohort layout for cohort storytelling, and the geographic-distribution map for regional analysis.
Each design balances statistical accuracy with the visual clarity that policy and marketing audiences require.
Open the file and update segments, percentages, and brand colors in minutes. A solid fit for market-research reports, public-policy briefings, HR diversity reports, brand-strategy decks, and any moment when audience composition needs to be made vivid and easy to navigate.